PROTECTED SOURCE SCRIPT
Mean Reversion Probability
Mean Reversion Probability
Lookback Period (default 100): The number of candles used to calculate the average and standard deviation
Standard Deviation Multiplier (default 2.0): Determines how wide the bands are around the mean
Probability Band Length (default 20): Controls how far the probability calculations extend
Reading the Indicator
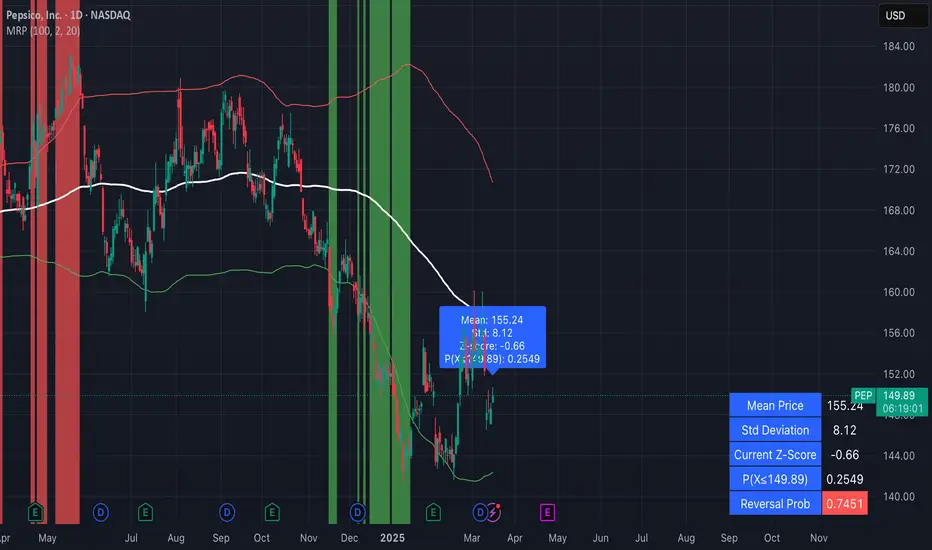
The indicator displays several key elements:
Mean Line (Blue): The average closing price over the lookback period
Upper/Lower Bands (Red/Green): Statistically significant deviation levels (similar to Bollinger Bands)
On-Chart Labels: Show real-time statistical measurements:
Mean price
Standard deviation
Z-score (how many standard deviations from the mean)
Probability calculations
"CORRECTION LIKELY" warning when appropriate
Background Color: Changes to red or green when prices reach extreme levels
Arrow Signals:
Red down arrows appear when price crosses above the upper band (potential reversal down)
Green up arrows appear when price crosses below the lower band (potential reversal up)
Information Table: Shows detailed probability statistics in the corner of your chart
Trading Strategies
Mean Reversion Strategy:
When price reaches the upper band (red background): Consider selling or taking profits
When price reaches the lower band (green background): Consider buying or adding positions
Probability-Based Trading:
Use the probability values to gauge the likelihood of a reversal
Higher reversion probability (>0.7) suggests stronger mean reversion potential
The Z-score tells you how extreme the current price is (values >2 or <-2 are statistically significant)
Combining with Other Indicators:
Use RSI or MACD to confirm overbought/oversold conditions
Use volume indicators to confirm potential reversals
Look for candlestick patterns at the band extremes for additional confirmation
Real-World Example
In your screenshot, you can see a similar analysis where:
The price was at 31.18
The standard deviation was 7.3
The probability calculation P(X≤18.87) was 0.0465
This low probability (4.65%) indicated that the price was statistically unlikely to fall below 18.87, suggesting a potential buying opportunity near that level.
Skrip dilindungi
Skrip ini diterbitkan sebagai sumber tertutup. Akan tetapi, anda boleh menggunakannya secara bebas dan tanpa apa-apa had – ketahui lebih di sini.
Penafian
Maklumat dan penerbitan adalah tidak bertujuan, dan tidak membentuk, nasihat atau cadangan kewangan, pelaburan, dagangan atau jenis lain yang diberikan atau disahkan oleh TradingView. Baca lebih dalam Terma Penggunaan.