OPEN-SOURCE SCRIPT
Ease of Movement (EOM)
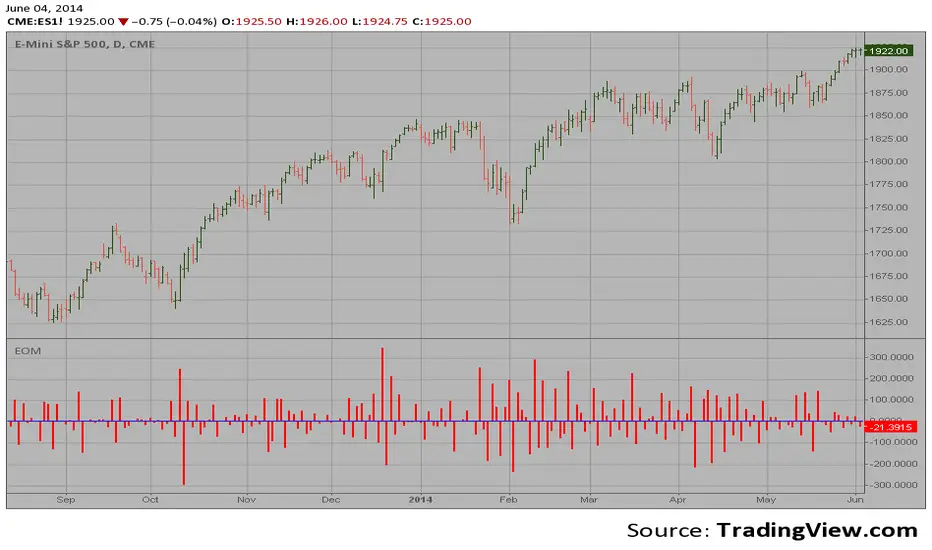
This indicator gauges the magnitude of price and volume movement.
The indicator returns both positive and negative values where a
positive value means the market has moved up from yesterday's value
and a negative value means the market has moved down. A large positive
or large negative value indicates a large move in price and/or lighter
volume. A small positive or small negative value indicates a small move
in price and/or heavier volume.
A positive or negative numeric value. A positive value means the market
has moved up from yesterday's value, whereas, a negative value means the
market has moved down.
Skrip sumber terbuka
Dalam semangat sebenar TradingView, pencipta skrip ini telah menjadikannya sumber terbuka supaya pedagang dapat menilai dan mengesahkan kefungsiannya. Terima kasih kepada penulis! Walaupun anda boleh menggunakannya secara percuma, ingat bahawa menerbitkan semula kod ini adalah tertakluk kepada Peraturan Dalaman kami.
Penafian
Maklumat dan penerbitan adalah tidak dimaksudkan untuk menjadi, dan tidak membentuk, nasihat untuk kewangan, pelaburan, perdagangan dan jenis-jenis lain atau cadangan yang dibekalkan atau disahkan oleh TradingView. Baca dengan lebih lanjut di Terma Penggunaan.