Volumetric Spectrogram [by Oberlunar]
A two-pole, price-relative volume profiler that turns regional buy/sell pressure into clean oscillators and actionable regimes in a multi-broker setup.
What it measures
The indicator divides the recent price span into bins and accumulates buy vs. sell volume in each bin, then summarises two regions with respect to the current price:
- Upper (↑) — volume that traded above the current price (overhead supply/demand).
- Lower (↓) — volume that traded below the current price (underfoot bid/pressure).
Per region, it computes BUY% and SELL%, then forms two normalised oscillators in [−1, +1]:
- Upper Osc = Upper(BUY%) − Upper(SELL%) → positive when overhead offers are being lifted (breakout acceptance), negative when overhead sell pressure dominates (resistance).
- Lower Osc = Lower(BUY%) − Lower(SELL%) → positive when sub-price bids strengthen (support/absorption), negative when selling persists beneath price (weak underbelly).
Both oscillators are optionally smoothed with EMA and can be filled to zero or between curves for quick polarity/strength reading.
Candle-fill modes across brokers
The indicator supports multiple candle-fill policies tied to cross-broker volumetric agreement (e.g., spectral/range-only fills when ≥N brokers align above 70% bullish or below 20% bearish Buy%). This makes regime and pressure shifts visually explicit while filtering out unconfirmed noise.
How it works (core algorithm)
- Over a lookback window, find the high/low and split the range into N bins.
- For each historical bar, approximate “buy” vs “sell” volume using candle direction and the close relative to each bin’s midprice; update left/right profiles per bin.
- Aggregate bins above the current price into the Upper region and bins below into the Lower region; compute regional totals and percentages.
- Convert to signed oscillators and smooth (EMA length per input).
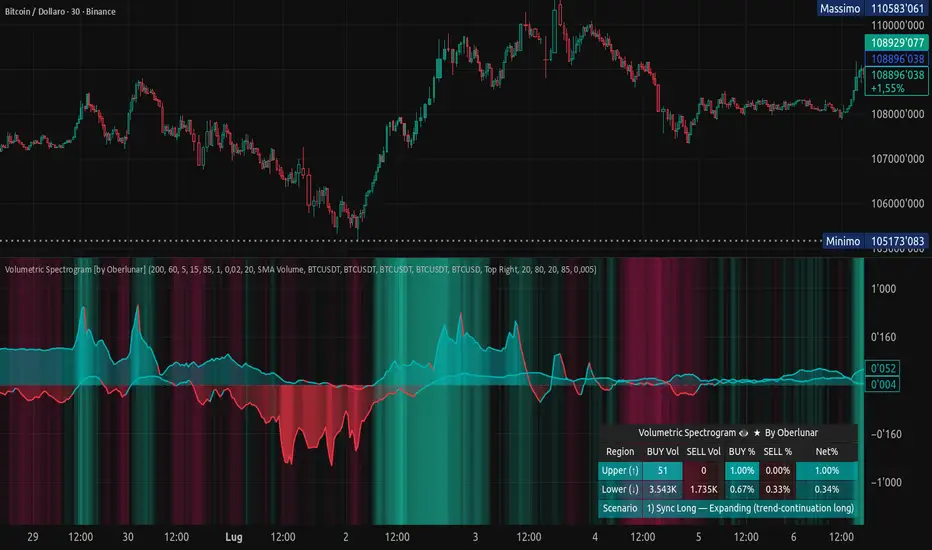
Scenario engine (table, every bar)
A compact table reports, for Upper/Lower: BUY Vol, SELL Vol, BUY%, SELL%, and Net%. A classifier labels 8 regimes based on oscillator sign and recent expansion/decay: Sync Long/Short (Expanding/Decaying), Opposite Signs (Widening/Converging), and Tilts (Upper/Lower). This helps distinguish trend continuation, fade risk, compression before break, and asymmetric pressure (e.g., “Tilt Lower — bid/support strengthening”).
# Example strategies and annotated cases:
There are different operational strategies:
1) Bottle-neck Strategy with multi-broker confirmation
When both oscillators are red and they compress toward the zero line (a bottle-neck[/i>), if the squeeze does not flip into the opposite trend but instead resolves in the same direction, you have a continuation setup that can be exploited:
• Pattern: both oscillators red → short, visible contraction (narrow, low-variance cluster) → break of the cluster lows → background shadow bars align bearish (multi-broker agreement).
Example:
This sequence often supports a 1.5–2.5 R/R trade, as in:
Bullish mirror
If both oscillators are teal and compress, then expand upward with multi-broker agreement, the scenario becomes bullish after several bars; the position can be profitable with a reasonable risk setup:
Example:
Follow-through:
Here are the additional, English “playbook” examples you can append to the previous description.
2) Dual-confirmation on volume spikes + multi-broker checks
When pronounced volumetric spikes appear (up or down), trend often reverses sharply. In the figure, the circles highlight the spikes; once the spike subsides (reversion toward baseline), the oscillator turns bullish. The double confirmation of two consecutive minimum spikes acts as support for an ensuing up-move, with fill colors confirming direction.
Chart:
Even with a single spike confirmation, the reversion from an extreme often provides actionable long setups.
3) Volume-pressure + regime-change (multi-broker)
A prospective long configuration emerges when bullish volumetric pressure dominates and bearish pressure fades, especially if this occurs after a lateral phase, followed by a bullish volume spike and multi-broker confirmation.
Chart:
Shadow bars subsequently confirm continuation in a bullish regime; however, a possible regime change is flagged by the scenario classifier and by a color flip in the volumetric borders (“Possible regime change, but without multi-broker confirmation.” is an appropriate label when applicable).
Chart:
After a verified mean-reversion, price transitions into a bearish configuration: both oscillators turn red. One can wait for a pullback and seek short entries.
Chart:
As shown here, the regime change is anticipated well in advance by the oscillators and multi-broker pressure:
Chart:
4) Contrastive regime-shift with multi-broker validation
In a contrastive trading phase, the lower volumetric oscillator flips color first—buyers start attacking. The first set of background shadow bars does not agree with the regime flip; the second set does. This sequence (oscillator flip → later multi-broker agreement) is a robust early sign of a potential long setup.
Chart:
At the multi-broker level, all shadow bars turn fully green and the setup becomes unambiguously bullish.
Chart:
Note that bearish pressure can still be non-trivial on the volumetric scale—even if it does not reach prior extreme minima—so risk controls should reflect the residual supply.
Delta-bar coloring (optional)
Bars (or candle overlays) can be tinted by a multi-venue weighted bias:
- Choose venues (OKX, Coinbase, Bybit, Binance, BlackBull…).
- Weight by Equal / Last Volume / SMA Volume.
- Apply deadband to suppress flicker around neutrality and a gamma curve to modulate opacity with |bias|.
This layer is independent of the spectrogram core but provides immediate market-wide flow context, consistent with the table and fills.
Inputs (essentials)
- Calculation Period and Bins — resolution and depth of the price-range histogram.
- EMA length — smoothing per oscillator (optional)
- Fill options — to zero / between curves, gradual opacity by |osc|, min/max alpha.
- Delta Bar — enable tinting, gamma, neutral band; venue list and weighting mode.
Reading guide
- Upper > 0 & expanding: overhead supply is being lifted → breakout acceptance risk rises.
- Lower > 0 & expanding: sub-price bids strengthen → pullbacks more likely to absorb.
- Opposite signs widening: tug-of-war; avoid late entries.
- Converging: compression → prepare for break.
- Use the table’s regime label to keep the narrative honest bar-by-bar.
Notes & limits
- Buy/Sell attribution uses candle direction and range partitioning (no L2/tick tape).
- Venue aggregation relies on per-exchange volume and your chosen weighting; symbols must align (e.g., BTCUSDT pairs).
- Oscillators are relative to the current price (regional) by design; they complement, not replace, classical volume profile.
— Oberlunar 👁 ★
The upgraded Volumetric Spectrogram now includes yellow sideways bands, which are Oberlunar’s most advanced system for detecting lateral regimes and pre-breakout volume compression before it becomes obvious in price. These bands are driven by a pure stochastic state machine that runs on every bar and works on any timeframe. These sideways yellow bands help you systematically avoid entering trades too early into noisy consolidations and instead focus on timing entries around the edges of genuine pre-explosive compressions, where the probability of a meaningful volumetric move is structurally higher.
Internally, the engine builds a lateral “sideScore” by combining several normalized components: ATR in percent of price to detect low-volatility phases, Bollinger Band width in percent to spot compressed ranges, the slope of a linear regression of price to penalize strong trends, a breakout rate based on how often new highs or lows are printed, an optional ADX term that discounts strong directional moves, and a BB-ratio term that measures how much time price spends inside the Bollinger envelope and how stable that positioning is over time.
Each component is converted into a stochastic score, which can be compared to a dynamic percentile of its own history, making the system self-calibrating to different market regimes.
On top of this, a width gate ensures that only ranges of meaningful size are considered: the engine measures the percentage width between the highest high and lowest low over a seed window and requires it to stay between a minimum and maximum band, so you do not flag microscopic noise or excessively wide, already-exploded ranges as sideways.
The result is passed through a hysteresis state machine with counters for consecutive “on” and “off” conditions (runOn and runOff): the state flips to inSide only after a minimum number of confirming bars and exits only after persistent deterioration or a hard break, defined as price violently breaching a smoothed channel plus a configurable pad.
Whenever inSide is true, the Volumetric Spectrogram paints a continuous yellow corridor across the oscillator panel, visually marking the exact interval where volatility is compressed, breakouts are rare, and directional conviction is low, yet underlying order flow is often quietly repositioning.
by Oberlunar ★ 👁
Skrip jemputan sahaja
Hanya pengguna disahkan oleh penulis boleh mengakses skrip ini. Anda perlu memohon dan mendapatkan kebenaran untuk menggunakannya. Keizinan selalunya diberikan selepas pembayaran. Untuk lebih butiran, ikuti arahan penulis di bawah atau hubungi oberlunar_tr secara terus.
TradingView TIDAK menyarankan pembayaran atau penggunaan skrip kecuali anda mempercayai sepenuhnya penulis dan memahami bagaimana ia berfungsi. Anda juga boleh menjumpai alternatif sumber terbuka dan percuma yang lain di dalam skrip komuniti kami.
Arahan penulis
t.me/oberlunar_btcusd
My community is free, but if you’re not present and
don’t interact, you’re out.
Penafian
Skrip jemputan sahaja
Hanya pengguna disahkan oleh penulis boleh mengakses skrip ini. Anda perlu memohon dan mendapatkan kebenaran untuk menggunakannya. Keizinan selalunya diberikan selepas pembayaran. Untuk lebih butiran, ikuti arahan penulis di bawah atau hubungi oberlunar_tr secara terus.
TradingView TIDAK menyarankan pembayaran atau penggunaan skrip kecuali anda mempercayai sepenuhnya penulis dan memahami bagaimana ia berfungsi. Anda juga boleh menjumpai alternatif sumber terbuka dan percuma yang lain di dalam skrip komuniti kami.
Arahan penulis
t.me/oberlunar_btcusd
My community is free, but if you’re not present and
don’t interact, you’re out.