Delta Volume Profile [BigBeluga]🔵Delta Volume Profile
A dynamic volume analysis tool that builds two separate horizontal profiles: one for bullish candles and one for bearish candles. This indicator helps traders identify the true balance of buying vs. selling volume across price levels, highlighting points of control (POCs), delta dominance, and hidden volume clusters with remarkable precision.
🔵 KEY FEATURES
Split Volume Profiles (Bull vs. Bear):
The indicator separates volume based on candle direction:
If close > open , the candle’s volume is added to the bullish profile (positive volume).
If close < open , it contributes to the bearish profile (negative volume).
ATR-Based Binning:
The price range over the selected lookback is split into bins using ATR(200) as the bin height.
Each bin accumulates both bull and bear volumes to form the dual-sided profile.
Bull and Bear Volume Bars:
Bullish volumes are shown as right-facing bars on the right side, colored with a bullish gradient.
Bearish volumes appear as left-facing bars on the left side, shaded with a bearish gradient.
Each bar includes a volume label (e.g., +12.45K or -9.33K) to show exact volume at that price level.
Points of Control (POC) Highlighting:
The bin with the highest bullish volume is marked with a border in POC+ color (default: blue).
The bin with the highest bearish volume is marked with a POC− color (default: orange).
Total Volume Density Map:
A neutral gray background box is plotted behind candles showing the total volume (bull + bear) per bin.
This reveals high-interest price zones regardless of direction.
Delta and Total Volume Summary:
A Delta label appears at the top, showing net % difference between bull and bear volume.
A Total label at the bottom shows total accumulated volume across all bins.
🔵 HOW IT WORKS
The indicator captures all candles within the lookback period .
It calculates the price range and splits it into bins using ATR for adaptive resolution.
For each candle:
If price intersects a bin and close > open , volume is added to the positive profile .
If close < open , volume is added to the negative profile .
The result is two side-by-side histograms at each price level—one for buyers, one for sellers.
The bin with the highest value on each side is visually emphasized using POC highlight colors.
At the end, the script calculates:
Delta: Total % difference between bull and bear volumes.
Total: Sum of all volumes in the lookback window.
🔵 USAGE
Volume Imbalance Zones: Identify price levels where buyers or sellers were clearly dominant.
Fade or Follow Volume Clusters: Use POC+ or POC− levels for reaction trades or breakouts.
Delta Strength Filtering: Strong delta values (> ±20%) suggest momentum or exhaustion setups.
Volume-Based Anchoring: Use profile levels to mark hidden support/resistance and execution zones.
🔵 CONCLUSION
Delta Volume Profile offers a unique advantage in market reading by separating buyer and seller activity into two visual layers. This allows traders to not only spot where volume was high, but also who was more aggressive. Whether you’re analyzing trend continuations, reversals, or absorption levels, this indicator gives you the transparency needed to trade with confidence.
Volumeprofileindicator

VOL & AVG OverlayCustom Session Volume Versus Average Volume
Description:
This indicator will create an overlay on your chart that will show you the following information:
Custom Session Volume
Average For Selected Session
Percentage Comparison
Options:
Set Custom Time Frame For Calculations
Set Custom Time Frame For Average Comparison
Set Custom Time Zone
Enable / Disable Each Value
Change Text Color
Change Background Color
Change Table location
Example:
Set indicator to 30 period average. Set custom time frame to 9:30am to 10:30am Eastern/New York.
When the time frame for the calculation is closed , the indicator will provide a comparison of the current days volume compared to the average of 30 previous days for that same time frame and display it as a percentage in the table.
In this example you could compare how the first hour of the trading day compares to the previous 30 day's average, aiding in evaluating the potential volume for the remainder of the day.
Notes:
Times must be entered in 24 hour format. (1pm = 13:00 etc.)
This indicator is for Intra-day time frames, not > Day.
If you prefer data in this format as opposed to a plotted line, check out my other indicator: ADR & ATR Overlay

Multi-Layer Volume Profile [BigBeluga]A powerful multi-resolution volume analysis tool that stacks multiple profiles of historical trading activity to reveal true market structure.
This indicator breaks down total and delta volume distribution across time at four adjustable depths — enabling traders to spot major POCs, volume shelves, and zones of price acceptance or rejection with unmatched clarity.
🔵 KEY FEATURES
Multi-Layer Volume Profiles:
Up to 4 separate volume profiles are stacked on the chart:
- Profile 1: Full period
- Profile 2: Half-length
- Profile 3: Quarter-length
- Profile 4: One-eighth-length
This layering helps traders assess confluence across different time horizons.
Custom Bin Resolution:
Each profile uses a customizable number of bins to control visual precision.
More bins = higher granularity, fewer bins = smoother profile.
Precise POC Highlighting:
The price level with the maximum traded volume in each profile is highlighted with a thick blue POC line.
This key level shows the most accepted price for each period.
Total and Delta Volume Labels:
- Total Volume: Displays cumulative volume over the profile period at the top of the profile box.
- Delta Volume: The difference between bullish and bearish volume is labeled at the base, showing directional pressure.
Positive delta = buyer dominance, negative delta = seller dominance.
Range Levels:
Each profile includes horizontal reference lines showing its high, low, bounds.
These edges often align with price reaction zones and become future resistance/support.
🔵 HOW IT WORKS
For each active profile, the indicator:
- Collects price range (highs/lows) across the selected `length`
- Divides this range into equal bins
- Assigns volume into bins based on candle close location
- Aggregates volume per bin to form the profile (polylines)
Separately tracks:
- Total volume (sum of all candles in range)
- Delta volume (sum of candle volumes: positive for bullish, negative for bearish closes)
Highlights the bin with maximum volume (POC)
and marks it with a thick blue line.
Adds auxiliary lines for high/low of each profile box
and total/delta volume tags with tooltips.
🔵 USAGE
Spot Acceptance Zones:
Thick, flat areas on the profile show where price stayed longest — ideal for building positions.
Identify Rejection Zones:
Thin volume areas signal price rejection and are often used for stop placement or entries.
Delta Confirmation:
Use strong positive/negative delta readings as directional bias confirmation for breakout trades.
Confluence Detection:
Watch for overlapping POCs between layers to identify extremely strong support/resistance zones.
🔵 CONCLUSION
Multi-Layer Volume Profile equips traders with a deeply layered market structure view.
Whether you're scalping intraday levels or analyzing macro support zones, the ability to stack volume perspectives, visualize directional delta, and anchor POCs provides an edge in anticipating market moves.
Use this tool to validate entries, confirm structure, and make more informed, volume-aware trading decisions.

Volume Profile [ActiveQuants]The Volume Profile indicator visualizes the distribution of trading volume across price levels over a user-defined historical period. It identifies key liquidity zones, including the Point of Control (POC) (price level with the highest volume) and the Value Area (price range containing a specified percentage of total volume). This tool is ideal for traders analyzing support/resistance levels, market sentiment , and potential price reversals .
█ CORE METHODOLOGY
Vertical Price Rows: Divides the price range of the selected lookback period into equal-height rows.
Volume Aggregation: Accumulates bullish/bearish or total volume within each price row.
POC: The row with the highest total volume.
Value Area: Expands from the POC until cumulative volume meets the user-defined threshold (e.g., 70%).
Dynamic Visualization: Rows are plotted as horizontal boxes with widths proportional to their volume.
█ KEY FEATURES
- Customizable Lookback & Resolution
Adjust the historical period ( Lookback ) and granularity ( Number of Rows ) for precise analysis.
- Configurable Profile Width & Horizontal Offset
Control the relative horizontal length of the profile rows, and set the distance from the current bar to the POC row’s anchor.
Important: Do not set the horizontal offset too high. Indicators cannot be plotted more than 500 bars into the future.
- Value Area & POC Highlighting
Set the percentage of total volume required to form the Value Area , ensuring that key volume levels are clearly identified.
Value Area rows are colored distinctly, while the POC is marked with a bold line.
- Flexible Display Options
Show bullish/bearish volume splits or total volume.
Place the profile on the right or left of the chart.
- Gradient Coloring
Rows fade in color intensity based on their relative volume strength .
- Real-Time Adjustments
Modify horizontal offset, profile width, and appearance without reloading.
█ USAGE EXAMPLES
Example 1: Basic Volume Profile with Value Area
Settings:
Lookback: 500 bars
Number of Rows: 100
Value Area: 70%
Display Type: Up/Down
Placement: Right
Image Context:
The profile appears on the right side of the chart. The POC (orange line) marks the highest volume row. Value Area rows (green/red) extend above/below the POC, containing 70% of total volume.
Example 2: Total Volume with Gradient Colors
Settings:
Lookback: 800 bars
Number of Rows: 100
Profile Width: 60
Horizontal Offset: 20
Display Type: Total
Gradient Colors: Enabled
Image Context:
Rows display total volume in a single color with gradient transparency. Darker rows indicate higher volume concentration.
Example 3: Left-Aligned Profile with Narrow Value Area
Settings:
Lookback: 600 bars
Number of Rows: 100
Profile Width: 45
Horizontal Offset: 500
Value Area: 50%
Profile Placement: Left
Image Context:
The profile shifts to the left, with a tighter Value Area (50%).
█ USER INPUTS
Calculation Settings
Lookback: Historical bars analyzed (default: 500).
Number of Rows: Vertical resolution of the profile (default: 100).
Profile Width: Horizontal length of rows (default: 50).
Horizontal Offset: Distance from the current bar to the POC (default: 50).
Value Area (%): Cumulative volume threshold for the Value Area (default: 70%).
Volume Display: Toggle between Up/Down (bullish/bearish) or Total volume.
Profile Placement: Align profile to the Right or Left of the chart.
Appearance
Rows Border: Customize border width/color.
Gradient Colors: Enable fading color effects.
Value Area Colors: Set distinct colors for bullish and bearish Value Area rows.
POC Line: Adjust color, width, and visibility.
█ CONCLUSION
The Volume Profile indicator provides a dynamic, customizable view of market liquidity. By highlighting the POC and Value Area, traders can identify high-probability reversal zones, gauge market sentiment, and align entries/exits with key volume levels.
█ IMPORTANT NOTES
⚠ Lookback Period: Shorter lookbacks prioritize recent activity but may omit critical levels.
⚠ Horizontal Offset Limitation: Avoid excessively high offsets (e.g., close to ±300). TradingView restricts plotting indicators more than 500 bars into the future, which may truncate or hide the profile.
⚠ Risk Management: While the indicator highlights areas of concentrated volume, always use it in combination with other technical analysis tools and proper risk management techniques.
█ RISK DISCLAIMER
Trading involves substantial risk. The Volume Profile highlights historical liquidity but does not predict future price movements. Always use stop-loss orders and confirm signals with additional analysis. Past performance is not indicative of future results.
📊 Happy trading! 🚀

Volume Zones Internal Visualizer [LuxAlgo]The Volume Zones Internal Visualizer is an alternate candle type intended to reveal lower timeframe volume activity while on a higher timeframe chart.
It displays the candle's range, the highest and lowest zones of accumulated volume throughout the candle, and the Lower Timeframe (LTF) candle close, which contained the most volume in the session (Candle Session).
🔶 USAGE
The indicator is intended to be used as its own independent candle type. It is not a replacement for traditional candlesticks; however, it is recommended that you hide the chart's display when using this indicator. Another option is to display this indicator in an additional pane alongside the normal chart, as displayed above.
The display consists of candle ranges represented by outlined boxes, within the ranges you will notice a transparent-colored zone, a solid-colored zone, and a line.
Each of these displays different points of volume-related information from an analysis of LTF data.
In addition to this analysis, the indicator also locates the LTF candle with the highest volume, and displays its close represented by the line. This line is considered as the "Peak Activity Level" (PAL), since throughout the (HTF) candle session, this candle's close is the outcome of the most volume transacted at the time.
We are further tracking these PALs by continuing to extend them into the future, looking towards them for potential further interaction. Once a PAL is crossed, we are removing it from display as it has been mitigated.
🔶 DETAILS
The indicator aggregates the volume data from each LTF candle and creates a volume profile from it; the number of rows in the profile is determined by the "Row Size" setting.
With this profile, it locates and displays the highest (solid area) and lowest (transparent area) volume zones from the profile created.
🔶 SETTINGS
Row Size: Sets the number of rows used for the calculation of the volume profile based on LTF data.
Intrabar Timeframe: Sets the Lower Timeframe to use for calculations.
Show Last Unmitigated PALs: Choose how many Unmitigated PALs to extend.
Style: Toggle on and off features, as well as adjust colors for each.

IQ Zones [TradingIQ]Hey Traders!
Introducing "IQ Zones".
"IQ Zones" is an indicator that combines support and resistance identification with volume, the "value area" of a candlestick to be exact. IQ Zones identifies turning points in the market; however, the candlestick high or low that formed the key turning point is not necessarily distinguished as the support/resistance area. Instead, the script looks into the bar at lower timeframes and calculates the value area of the candlestick that formed the support or resistance level. Therefore, any lines protruding from a candlestick reflect the value area of that candlestick. These levels (value area high and value area low) are marked on the candlestick as a support/resistance level. If the level formed on high volume it's marked as an "IQ Zone".
Additionally, IQ Zones presents a heat map to show volume intensity at nearby price areas. The heatmap is a product of the Volume Profile (IQ Profile) located on the right of the chart.
The IQ Profile is a segmented volume profile. Recent price is split into fifths (customizable), and individual volume profiles are calculated for all segmented price areas. Price is split into more than one segment to avoid a situation where volume in a ranging price zone far surpasses all other recent price areas - creating an "unusable" volume profile that doesn't offer helpful insights. If desired, you can set the segmenting option to "1" to calculate one unified volume profile for the entire price range.
The image above shows IQ Zones in action!
Core Features of IQ Zones
Value Area Support and Resistance Levels
Segmented volume profile for the recent trading period
Volume intensity heatmap
Support and resistance levels in high volume intensity may be more significant as price stoppers
The image above explains the labels marked along the y-axis of the IQ Profile.
The "more green" a price area/label is, the higher the volume intensity at the marked support/resistance area.
The image above further explains line lines protruding from the IQ Profile.
For this example, the value area of the candlestick (where most trading action occurred) is quite far from the high price of the candlestick that formed a resistance level! Using the value area of a candlestick that marks a key turning point to draw support/resistance offers insight into where the majority of trading action took place when the support/resistance level was forming!
Additionally, you can hover your mouse over the IQ Zone labels (triangles pointing up or down) to see the prices of the value area for the support/resistance level, including the total buying volume and total selling volume at the price area!
The image above further explains the IQ Profile!
You can segment the recent price area anywhere from 1 - 15 times.
The image above further explains IQ Zones and the IQ Profile!
That will be all for this indicator - a fun project to share with the community.
Thank you!

Volume Profile Heatmap [UAlgo]The "Volume Profile Heatmap " indicator is a tool designed to visualize the distribution of trading volume across different price levels over a specified period. This heatmap-style indicator helps traders identify significant price levels where a high volume of trading activity has occurred, which can be crucial for making informed trading decisions. The indicator divides the price range into multiple levels and calculates the volume of trades occurring at each level, presenting this data in a visually intuitive manner using a gradient of colors.
By analyzing the volume profile, traders can gain insights into areas of support and resistance, as well as the Point of Control (POC)—the price level with the highest traded volume. This information is valuable in assessing market sentiment, potential reversal points, and key areas of interest where price action might consolidate or react.
🔶 Key Features
Customizable Analysis Period: The indicator allows users to specify the analysis period, defining the historical range over which the volume profile is calculated.
Adjustable Number of Levels: Users can set the number of price levels to divide the price range, offering flexibility in the granularity of the volume analysis.
Color-Coded Heatmap: The indicator uses a gradient color scheme to visually represent volume intensity at each price level. Higher volume areas are shaded differently than lower volume areas, making it easy to spot significant price levels.
Opacity Control: Users can adjust the opacity of the volume boxes, enabling a clearer or more subtle visualization according to their preferences.
Point of Control (POC) Display: The indicator highlights the Point of Control, the price level with the highest traded volume, with a distinct line on the chart, allowing traders to easily identify this critical level.
🔶 Disclaimer
Use with Caution: This indicator is provided for educational and informational purposes only and should not be considered as financial advice. Users should exercise caution and perform their own analysis before making trading decisions based on the indicator's signals.
Not Financial Advice: The information provided by this indicator does not constitute financial advice, and the creator (UAlgo) shall not be held responsible for any trading losses incurred as a result of using this indicator.
Backtesting Recommended: Traders are encouraged to backtest the indicator thoroughly on historical data before using it in live trading to assess its performance and suitability for their trading strategies.
Risk Management: Trading involves inherent risks, and users should implement proper risk management strategies, including but not limited to stop-loss orders and position sizing, to mitigate potential losses.
No Guarantees: The accuracy and reliability of the indicator's signals cannot be guaranteed, as they are based on historical price data and past performance may not be indicative of future results.

Weighted Volume Profile Pivot Points | Flux Charts💎 GENERAL OVERVIEW
Introducing our new Weighted Volume Profile Pivot Points (WVPPP) Indicator! This indicator renders a volume profile using the latest pivot points, automatically adjusting itself when new pivots occur. The pivoting mode can be switched between default pivot points and order blocks mode. It can be adjusted to give more weight to recent or past candlesticks, or can be used as a normal volume profile. For more information, please read the full write-up.
Features of the new Weighted Volume Profile Pivot Points (WVPPP) Indicator :
Renders Volume Profile Of The Range Between Latest Pivots
Two Pivoting Modes Including Order Blocks Mode
Adjustable Weighthing Towards Past or Recent
Customizable Row Count & Maximum Distance
Left or Right Alignment
More Styling Options
🚩UNIQUENESS
This indicator stands out with two key features. One is it's ability to weight volumes based on their distance to the current time. Giving weight to volumes may offer new trading opportunities to traders as they can now see the most recent Point Of Control (POC) or a more powerful but past POC based on their choice. Another key feature the indicator has is that it automatically finds latest valid pivot points, and uses that range for the volume profile. The range changes dynamically as new pivots points emerge. You can select between normal pivot points and order blocks mode. The indicator also has a variety of useful styling settings such as aligning the volume profile to the right or the left of the chart, POC Line styling and color settings for bullish & bearish volumes.
📌 HOW DOES IT WORK ?
A volume profile provides an in-depth look at trading activity over a period of time by plotting a histogram on the price axis. This indicator can also give weight to volumes based on their distance to the current time, essentially determining their importance for the profile. The range which the volume profile will cover is determined by the latest pivot points. Here is how it works step-by-step :
1. Determine how much candlesticks the volume profile will cover (Analyze Bars setting)
2. Find the latest pivot points. If the mode is set to "Pivots", the pivot points are the candlesticks which has the highest / lowest wick in X amount of bars (Swing Length setting). If the mode is set to "Order Blocks", the volume profile range is the area between the latest buyside order block and the sellside order block. Order blocks occur when there is a high amount of market orders exist on a price range. It is possible to find order blocks using specific candlestick formations on the chart. For more information about the order block detection, I suggest you checking the write-up of our "Volumized Order Blocks" script. Increasing the "Swing Length" setting is recommended when the mode is set to "Pivots", as this will help in finding stronger pivot points.
3. Make a range using the latest pivot points, then divide it into rows (Row Count setting)
4. Then for each candlestick, add it's volume to the corresponding row in the range. Note that the volume can be added into several rows if it overlaps with them all.
5. If the candlestick is a bullish candlestick, we add it's volume into the bullish volume of the row, if it's a bearish candlestick, we add it to the bearish volume of the row.
With the weighted volume mode, which is activated if "Volume Weighthing" setting is set to "Recent" or "Past", all volumes get a penalty based on their distance to the latest candletstick. For example, if the setting is set to "Recent", the latest candlestick contributes it's volume by 100% to the corresponding row, but the candlestick which is 50 candlesticks far from the current candlestick only contributes it's volume by ~17% to the row. The same applies to the "Past" setting, but in the reversed order, where past candlesticks have more priority than the current ones.
Volume contribution percent for "Recent" setting : ((100 * 0.85) / (i + 1)) + (100 * (1.0 - 0.85))
Volume contribution percent for "Past" setting : ((100 * 0.85) * ((i + 1) / N)) + (100 * (1.0 - 0.85))
Where i = candlestick index from right to left, N = total number of candlesticks analyzed by the volume profile.
The Point Of Control (POC) line is drawn from the row with the most total volume, and is generally considered as a strong level because a lot of trading volume happened on that particular row. Traders may use this line as a support & resistance level.
We believe that automatically ranging the volume profile to important pivot points will help traders see crucial volume information easier without unnecessary hassle. Traders can use this indicator to have an insight of areas which price moves quickly without much volume, or see areas that holds the price still for much longer and plan their trades accordingly.
⚙️SETTINGS
1. General Configuration
Mode -> The pivoting mode that is switchable between "Pivots" and "Order Blocks" as described in the write-up. Please read the upper section to understand how this setting works.
Analyze Bars -> Total amount of bars that will be analyzed by the indicator from right to left.
Row Count -> The amount of rows that will the vertical range between pivot points will be divided into.
Volume Weighting -> The volume weighting mode as explained in the write-up.
2. Style
Highlight Sessions -> The volume profile sessions will be highlighted with a blue tint. To prevent confusion, highlighting will not work if the alignment is set to "Right".
Align To -> The alignment of the volume profile.

Weighted Volume Profile | Flux Charts💎 GENERAL OVERVIEW
Introducing our new Weighted Volume Profile Indicator! This indicator renders a volume profile based on the volume of latest candlesticks. It can be adjusted to give more weight to recent or past candlesticks, or can be used as a normal volume profile. For more information, please read the full write-up.
Features of the new Weighted Volume Profile indicator :
Renders Volume Profile Of Current Ticker
Adjustable Weighthing Towards Past or Recent
Customizable Row Count & Maximum Distance
Left or Right Alignment
More Styling Options
🚩UNIQUENESS
This indicator differs from a normal volume profile indicator by it's ability to weight volumes based on their distance to the current time. Giving weight to volumes may offer new trading opportunities to traders as they can now see the most recent Point Of Control (POC) or a more powerful but past POC based on their choice. The indicator also has a variety of useful styling settings such as aligning the volume profile to the right or the left of the chart, POC Line styling and color settings for bullish & bearish volumes.
📌 HOW DOES IT WORK ?
A volume profile provides an in-depth look at trading activity over a period of time by plotting a histogram on the price axis. This indicator can also give weight to volumes based on their distance to the current time, essentially determining their importance for the profile. Here is how it works step-by-step :
1. Determine how much candlesticks the volume profile will cover (Analyze Bars setting)
2. Make a range from the highest point of chart to the lowest point of chart, then divide it into rows (Row Count setting)
3. For each candlestick, add it's volume to the corresponding row in the range. Note that the volume can be added into several rows if it overlaps with them.
4. If the candlestick is a bullish candlestick, we add it's volume into the bullish volume of the row, if it's a bearish candlestick, we add it to the bearish volume of the row.
With the weighted volume mode, which is activated if "Volume Weighthing" setting is set to "Recent" or "Past", all volumes get a penalty based on their distance to the latest candletstick. For example, if the setting is set to "Recent", the latest candlestick contributes it's volume by 100% to the corresponding row, but the candlestick which is 50 candlesticks far from the current candlestick only contributes it's volume by ~17% to the row. The same applies to the "Past" setting, but in the reversed order, where past candlesticks have more priority than the current ones.
Volume contribution percent for "Recent" setting : ((100 * 0.85) / (i + 1)) + (100 * (1.0 - 0.85))
Volume contribution percent for "Past" setting : ((100 * 0.85) * ((i + 1) / N)) + (100 * (1.0 - 0.85))
Where i = candlestick index from right to left, N = total number of candlesticks analyzed by the volume profile.
The Point Of Control (POC) line is drawn from the row with the most total volume, and is generally considered as a strong level because a lot of trading volume happened on that particular row. Traders may use this line as a support & resistance level.
Traders can use this indicator to have an insight of areas which price moves quickly without much volume, or see areas that holds the price still for much longer and plan their trades accordingly.
⚙️SETTINGS
1. General Configuration
Analyze Bars -> Total amount of bars that will be analyzed by the indicator from right to left.
Row Count -> The amount of rows that will the vertical range of chart will be divided into.
Volume Weighting -> The volume weighting mode as explained in the write-up.
2. Style
Align To -> The alignment of the volume profile.

Activity and Volume Orderflow Profile [AlgoAlpha]🔍 Activity and Volume Orderflow Profile 📊
🚀 Unlock the power of market order flow analysis with the Activity and Volume Orderflow Profile indicator by AlgoAlpha . This versatile tool helps you visualize and understand the dynamics of buying and selling pressure within a specified lookback period. Perfect for traders who want to dig deeper into volume-based market insights!
Key Features:
📊 Profile Type Options : Choose between "Comparison" and "Net Order Flow" to analyze market activity based on your preferred method.
🔎 Adjustable Lookback Period : Customize the lookback period to fit your trading strategy.
🎨 Flexible Appearance Settings : Toggle the display of the profile, lookback period visualization, and heatmap to suit your preferences.
🖍 Color Customization : Set your preferred colors for up and down volumes.
🕹 High Activity Highlight : Use the minimum transparency setting to highlight areas of significant activity.
Quick Guide to Using the Activity and Volume Orderflow Profile
🛠 Add the Indicator: Add the indicator to your favorites. Customize settings like profile type, lookback period, and resolution to fit your trading style.
📊 Market Analysis: Use the profile to identify areas of high buying or selling pressure. In "Comparison" mode, look for significant volume differences; in "Net Order Flow" mode, focus on net volume changes. Additionally, you can use the activity heatmap to find key levels that can act as support and resistance as price is likely to react to the zones as indicated by the heatmap.
How it Works:
The indicator operates by first gathering data on high and low prices, as well as buy and sell volumes, over a user-defined lookback period. It then calculates the maximum and minimum prices during this period and divides this range into bins based on the chosen resolution. For each bin, it computes the total volume of buy and sell orders. In "Comparison" mode, it displays side-by-side boxes representing buy and sell volumes, while in "Net Order Flow" mode, it shows the net volume difference. The indicator visually presents these profiles on the chart with customizable colors, transparency levels, and the option to display a heatmap for enhanced volume activity insights.
Maximize your trading with the Activity and Volume Orderflow Profile from AlgoAlpha! 🚀✨

Volume Profile with Node Detection [LuxAlgo]The Volume Profile with Node Detection is a charting tool that allows visualizing the distribution of traded volume across specific price levels and highlights significant volume nodes or clusters of volume nodes that traders may find relevant in utilizing in their trading strategies.
🔶 USAGE
The volume profile component of the script serves as the foundation for node detection while encompassing all the essential features expected from a volume profile. See the sub-sections below for more detailed information about the indicator components and their usage.
🔹 Peak Volume Node Detection
A volume peak node is identified when the volume profile nodes for the N preceding and N succeeding nodes are lower than that of the evaluated one.
Displaying peak volume nodes along with their surrounding N nodes (Zones or Clusters) helps visualize the range, typically representing consolidation zones in the market. This feature enables traders to identify areas where trading activity has intensified, potentially signaling periods of price consolidation or indecision among market participants.
🔹 Trough Volume Node Detection
A volume trough node is identified when the volume profile nodes for the N preceding and N succeeding nodes are higher than that of the evaluated one.
🔹 Highest and Lowest Volume Nodes
Both the highest and lowest volume areas play significant roles in trading. The highest volume areas typically represent zones of strong price acceptance, where a significant amount of trading activity has occurred. On the other hand, the lowest volume areas signify price levels with minimal trading activity, often indicating zones of price rejection or areas where market participants have shown less interest.
🔹 Volume profile
Volume profile is calculated based on the volume of trades that occur at various price levels within a specified timeframe. It divides the price range into discrete price intervals, typically known as "price buckets" or "price bars," and then calculates the total volume of trades that occur at each price level within those intervals. This information is then presented graphically as a histogram or profile, where the height of each bar represents the volume of trades that occurred at that particular price level.
🔶 SETTINGS
🔹 Volume Nodes
Volume Peaks: Toggles the visibility of either the "Peaks" or "Clusters" on the chart, depending on the specified percentage for detection.
Node Detection Percent %: Specifies the percentage for the Volume Peaks calculation.
Volume Troughs: Toggles the visibility of either the "Troughs" or "Clusters" on the chart, depending on the specified percentage for detection.
Node Detection Percent %: Specifies the percentage for the Volume Troughs calculation.
Volume Node Threshold %: A threshold value specified as a percentage is utilized to detect peak/trough volume nodes. If a value is set, the detection will disregard volume node values lower than the specified threshold.
Highest Volume Nodes: Toggles the visibility of the highest nodes for the specified count.
Lowest Volume Nodes: Toggles the visibility of the lowest nodes for the specified count.
🔹 Volume Profile - Components
Volume Profile: Toggles the visibility of the volume profile with either classical display or gradient display.
Value Area Up / Down: Color customization option for the volume nodes within the value area of the profile.
Profile Up / Down Volume: Color customization option for the volume nodes outside of the value area of the profile.
Point of Control: Toggles the visibility of the point of control, allowing selection between "developing" or "regular" modes. Sets the color and width of the point of control line accordingly.
Value Area High (VAH): Toggles the visibility of the value area high level and allows customization of the line color.
Value Area Low (VAL): Toggles the visibility of the value area low level and allows customization of the line color.
Profile Price Labels: Toggles the visibility of the Profile Price Levels and allows customization of the text size of the levels.
🔹 Volume Profile - Display Settings
Profile Lookback Length: Specifies the length of the profile lookback period.
Value Area (%): Specifies the percentage for calculating the value area.
Profile Placement: Specify where to display the profile.
Profile Number of Rows: Specify the number of rows the profile will have.
Profile Width %: Adjusts the width of the rows in the profile relative to the profile range.
Profile Horizontal Offset: Adjusts the horizontal offset of the profile when it is selected to be displayed on the right side of the chart.
Value Area Background: Toggles the visibility of the value area background and allows customization of the fill color.
Profile Background: Toggles the visibility of the profile background and allows customization of the fill color.
🔶 RELATED SCRIPTS
Supply-Demand-Profiles
Liquidity-Sentiment-Profile
Thanks to our community for recommending this script. For more conceptual scripts and related content, we welcome you to explore by visiting >>> LuxAlgo-Scripts .

Fixed volume profile & zonesHi all!
If you like volume profile and like to create zones, where the price might react, this indicator might be for you. It plots a fixed volume profile and creates a user defined number of zones (shelves) of high volume.
If you want to know more about volume profile you can about it here on TradingView: se.tradingview.com
To do
• Add possiblity to create alerts for zone entries, breakouts and retest
• The importance of zones are now based on high volume slots only. It might be changed to include the slots around the 'master slot' to determine if the area is of high importance or not, your suggestions here are welcome!
• Show total volume in 'values'
• Error if the data cannot be fetched
• Add value area
• Make earlier (more important shelves) more visible (less transparent)
• Add possiblity to skip zones
Known issues
• Script execution is long when the volume profile is created (should be none)
• In some cases you can get overlapping shelves, avoid this
Settings
• Main
• Start/end bar of the volume profile (this is required)
• Data
• Timeframe (for getting the volume data)
• Levels (the number of slots in the volume profile)
• Shelves (the number of zones with high volume to plot) and it's color
• Max slot (have this enabled if you want the shelf's highest volume slot to have a dotted line and choose it's color
• Show info (show the order of the plotted zone)
• Style (how the volume profile will look)
• Histogram box (the color of the background of the volume profile)
• Up (the color of bullish volume)
• Down (the color of bearish volume)
• Point of control (color and if it should be extended or not)
• Values and text color (show bullish and bearish volume values)
The defaults on all settings are based on the daily timeframe. This indicator is not 'complete' and I plan to work on it when I get the time.
Note that the precision for the volume profile is per candle, so some levels can have visuals as others but lower volume.
The slot (level) volume has to have a lower difference to the volume included in the shelf than the next volume to be checked to be included. If the level being checked for inclusion in a shelf is at the end of boundaries (high and low) of the volume profile, the volume has to be higher than the golden ratio of the volume before.
You can also use this indicator if you just want a volume profile to show, just set the the number of zones to plot (in 'Shelves') to 0.
I hope I haven't forgotten anything and that it's clear, let me know otherwise.
Best of trading luck!

Moving point of controlLibrary "moving_poc"
method getMovingPoc(averagePriceByVolumeHistory, ltfVolumeSerie, ltfPriceSerie, nbBarsToLookback)
Volume point of control (PoC) extracted from lower time frame data and previous time period
Namespace types: array
Parameters:
averagePriceByVolumeHistory (array) : An array of float to record previous PoC average
ltfVolumeSerie (array) : Source of volume for the lower timeframe (ltf)
ltfPriceSerie (array) : Source of price for the lower timeframe
nbBarsToLookback (int) : A number of bars determining the lookback period of this PoC
Returns: Serie of PoC

Money Flow Profile [LuxAlgo]The Money Flow Profile is a charting tool that measures the traded volume or the money flow at all price levels on the market over a specified time period and highlights the relationship between the price of a given asset and the willingness of traders to either buy or sell it, allowing traders to reveal dominant and/or significant price levels and to analyze the trading activity of a particular user-selected range.
This tool combines a volume/money flow profile, a sentiment profile, and price levels, where the right side of the profile highlights the distribution of the traded activity/money flow at different price levels, the left side of the profile highlights the market sentiment at those price levels, and in the middle the price levels.
🔶 USAGE
A volume/money flow profile is an advanced charting tool that displays the traded volume/money flow at different price levels over a specific period. It helps traders visualize where the majority of trading activity/money flow has occurred.
A sentiment profile is a difference between buy and sell volume/money flow aiming to highlight the sentiment/dominance at specific price levels.
Each row of the profile presents figures on volume and money flow specific to price levels.
High volume/money flow nodes indicate areas of high activity and are likely to act as support or resistance in the future. They attract price and try to hold it there. Conversely, low-volume nodes are areas with low trading activity, that are less subject to get revisited by the price. The market often bounces right over these levels, not staying for long. The "Profile Heatmap" option of the script helps to better emphasize the trading activity within each areas.
By measuring the traded activity at each price level the script presents an ability to highlight the consolidation zones, in other words, highlights accumulation and distribution zones. When the price moves toward one end of the consolidation and volume pick up, it can foreshadow a potential breakout.
Level of Significance, Point of Control, Highest Sentiment Zone, and Profile Price levels are some of the other profile-related options available with the script.
🔶 SETTINGS
The script takes into account user-defined parameters and plots the profiles, where detailed usage for each user-defined input parameter in indicator settings is provided with the related input's tooltip.
🔹 Profile Generic Settings
Lookback Length / Fixed Range: Sets the lookback length.
Profile Source: Sets the profile source, Volume, or Money Flow.
🔹 Profile Presentation Settings
Volume/Money Flow Profile: Toggles the visibility of the Volume/Money Flow Profile.
High Traded Nodes: Threshold and Color option for high traded nodes.
Average Traded Nodes: Color option for average traded nodes.
Low Traded Nodes: Threshold and Color option for low traded nodes.
🔹 Sentiment Profile Settings
Sentiment Profile: Toggles the visibility of the Sentiment Profile.
Sentiment Polarity Method: Sets the method used to calculate the up/down volume/money flow.
Bullish Nodes: Color option for Bullish Nodes.
Bearish Nodes: Color option for Bearish Nodes.
🔹 Profile Heatmap Settings
Profile Heatmap: Toggles the visibility of the profile heatmap.
Heatmap Source: Sets the source of the profile heatmap, Volume/Money Flow Profile, or Sentiment Profile.
Heatmap Transparency: Control the transparency of the profile heatmap.
🔹 Other Presentation Settings
Level of Significance: Toggles the visibility of the level of significance line/zone.
Consolidation Zones: Toggles the visibility of the consolidation zones.
Consolidation Threshold, Color: Sets the threshold value and zone color.
Highest Sentiment Zone: Toggles the visibility of the highest bullish or bearish sentiment zone.
Profile Price Levels, Color, Size: Toggles the visibility of the profile price levels, and sets the color and the size of the level labels.
Profile Range Background Fill: Toggles the visibility of the profiles range.
🔹 Other Settings
Number of Rows: Specify how many rows each profile histogram will have.
Profile Width %: Alters the width of the rows in the histogram, relative to the profile length
Profile Text Size: Alters the size of the text. Setting to Auto will keep the text within the box limits.
Profile Horizontal Offset: Enables to move profile in the horizontal axis.
🔶 RELATED SCRIPTS
Liquidity-Sentiment-Profile
Swing-Volume-Profiles
For more and other conceptual scripts you are kindly invited to visit LuxAlgo-Scripts .

Zig-Zag Volume Profile (Bull vs. Bear) [Kioseff Trading]Hello!
Thank you @Pinecoders and @TradingView for putting polylines in production and making this viable!!
This script "Zig Zag Volume Profile" implements the polyline feature for Pine Script!
Features
Volume Profile anchored to zig zag trends
Bull vs Bear profiles!
Delta x price level
Standard POC and value area lines, in addition to separated POCs and value area lines for bull profiles and bear profiles
Up to 9999 profile rows per zigzag trend
Stylistic options for profiles
Configurable zig zag - profiles generated for small to large trends
Polylines!
This script generates Bull vs. Bear volume profiles for zig zag trends!
The zigzag indicator is configurable as normal; minor and major trend volume profiles are calculable. This indicator can be thought of as "Volume Profile/Delta for Trends''.
Up to 9999 volume profile levels (price levels) can be calculated for each profile, thanks to the new polyline feature, allowing for less aggregation / more precision of volume at price and volume delta.
Zig Zag Bull Vs Bear Profiles
The image above shows primary functionality!
Green profiles = buying volume
Red profiles = selling volume
Profiles are generated for each trend identified by the zigzag indicator.
The image above shows the indicator calculating volume delta for specific price blocks on the profile. Aggregate volume delta for the identified trend is displayed over the profile!
The image above shows Bull Profile POC lines and value area lines. Bear Profile POC lines and value area lines are also shown!
All colors and transparencies are configurable to the user's liking :D
Additionally, you can select to have the profiles drawn on contrasting sides. Bull Profile on left and Bear Profile on right.
For a more traditional look - you can select to draw the Bull & Bear profiles on the same x-point.
The indicator is robust enough to calculate on "long zig zags" and "short zig zags"; curved profiles can also be used!
The image above exemplifies usage of the indicator!
Bull & Bear volume profiles are calculated for trends on the 30-second timeframe.
The image above shows a more "utilitarian" presentation of the profiles. Once more, line and linefill colors/transparencies are all customizable; the indicator can look however you would like it to!
The image above shows key levels, the Bull vs. Bear profile, and volume delta for the current trend!
That's about it :D
This indicator is part of a series titled "Bull vs. Bear" - a suite of profile-like indicators I will be releasing over coming days. Thanks for checking this out!
Of course, a big thank you to @RicardoSantos for his MathOperator library that I use in every script.
If you have any suggestions please feel free to share!

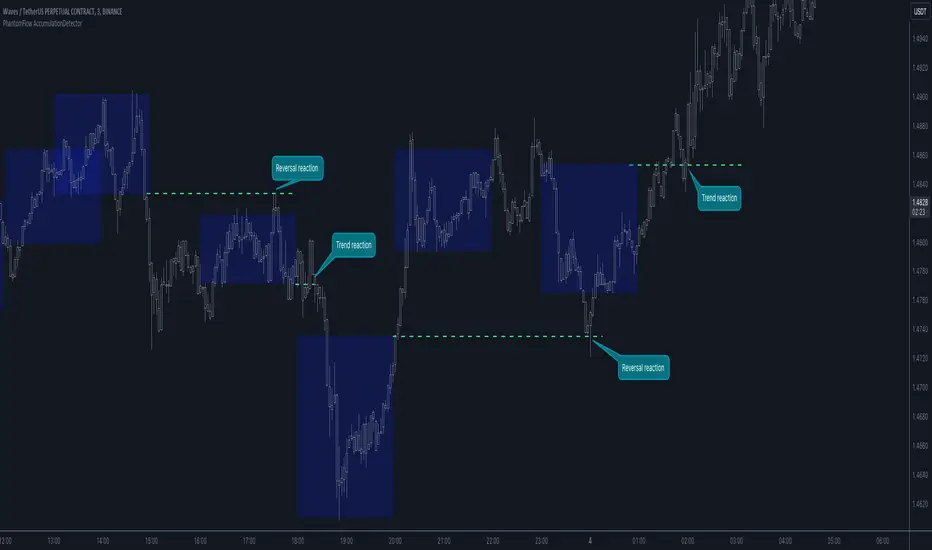
PhantomFlow AccumulationDetectorThe PhantomFlow AccumulationDetector indicator analyzes the volume profile and displays potential accumulation based on the selected timeframe in the settings. This indicator can be used both as zones for trend following and for identifying reversals, as shown in the examples on the chart. The logic behind the formation of the accumulation zone is based on the fact that the POC (Point of Control) of the current zone is within the Volume Area range of the previous period.
Optimal settings for the working timeframe should be chosen visually, and the size of the zones should not be too large or too small. Additionally, it's advisable not to consider overly wide zones during increased volatility.
Consecutive zones within the same range often indicate a potential reversal.
We borrowed the volume profile calculation code from @LonesomeTheBlue. Thank you for the work done!
Volume Profile (Maps) [LuxAlgo]The Pine Script® developers have unleashed "maps"!
Volume Profile (Maps) displays volume, associated with price, above and below the latest price, by using maps
The largest and second-largest volume is highlighted.
🔶 USAGE
The proposed script can highlight more frequent closing prices/prices with the highest volume, potentially highlighting more liquid areas. The prices with the highest associated volume (in red and orange in the indicator) can eventually be used as support/resistance levels.
Voids within the volume profile can highlight large price displacements (volatile variations).
🔶 CONCEPTS
🔹 Maps
A map object is a collection that consists of key - value pairs
Each key is unique and can only appear once. When adding a new value with a key that the map already contains, that value replaces the old value associated with the key .
You can change the value of a particular key though, for example adding volume (value) at the same price (key), the latter technique is used in this script.
Volume is added to the map, associated with a particular price (default close, can be set at high, low, open,...)
When the map already contains the same price (key), the value (volume) is added to the existing volume at the associated price.
A map can contain maximum 50K values, which is more than enough to hold 20K bars (Basic 5K - Premium plan 20K), so the whole history can be put into a map.
🔹 Visible line/box limit
We can only display maximum 500 line.new() though.
The code locates the current (last) close, and displays volume values around this price, using lines, for example 250 lines above and 250 lines below current price.
If one side contains fewer values, the other side can show more lines, taking the maximum out of the 500 visible line limitation.
Example (max. 500 lines visible)
• 100 values below close
• 2000 values above close
-> 100 values will be displayed below close
-> 400 remaining -> 400 values will be displayed above close
Pushing the limits even further, when ' Amount of bars ' is set higher than 500, boxes - box.new() - will be used as well.
These have a limit of 500 as well, bringing the total limit to 1000.
Note that there are visual differences when boxes overlap against lines.
If this is confusing, please keep ' Amount of bars ' at max. 500 (then only lines will be used).
🔹 Rounding function
This publication contains 2 round functions, which can be used to widen the Volume Profile
Round
• "Round" set at zero -> nothing changes to the source number
• "Round" set below zero -> x digit(s) after the decimal point, starting from the right side, and rounded.
• "Round" set above zero -> x digit(s) before the decimal point, starting from the right side, and rounded.
Example: 123456.789
0->123456.789
1->123456.79
2->123456.8
3->123457
-1->123460
-2->123500
Step
Another option is custom steps.
After setting "Round" to "Step", choose the desired steps in price,
Examples
• 2 -> 1234.00, 1236.00, 1238.00, 1240.00
• 5 -> 1230.00, 1235.00, 1240.00, 1245.00
• 100 -> 1200.00, 1300.00, 1400.00, 1500.00
• 0.05 -> 1234.00, 1234.05, 1234.10, 1234.15
•••
🔶 FEATURES
🔹 Adjust position & width
🔹 Table
The table shows the details:
• Size originalMap : amount of elements in original map
• # higher: amount of elements, higher than last "close" (source)
• index "close" : index of last "close" (source), or # element, lower than source
• Size newMap : amount of elements in new map (used for display lines)
• # higher : amount of elements in newMap, higher than last "close" (source)
• # lower : amount of elements in newMap, lower than last "close" (source)
🔹 Volume * currency
Let's take as example BTCUSD, relative to USD, 10 volume at a price of 100 BTCUSD will be very different than 10 volume at a price of 30000 (1K vs. 300K)
If you want volume to be associated with USD, enable Volume * currency . Volume will then be multiplied by the price:
• 10 volume, 1 BTC = 100 -> 1000
• 10 volume, 1 BTC = 30K -> 300K
Disabled
Enabled
🔶 DETAILS
🔹 Put
When the map doesn't contain a price, it will be added, using map.put(id, key, value)
In our code:
map.put(originalMap, price, volume)
or
originalMap.put(price, volume)
A key (price) is now associated with a value (volume) -> key : value
Since all keys are unique, we don't have to know its position to extract the value, we just need to know the key -> map.get(id, key)
We use map.get() when a certain key already exists in the map, and we want to add volume with that value.
if originalMap.contains(price)
originalMap.put(price, originalMap.get(price) + volume)
-> At the last bar, all prices (source) are now associated with volume.
🔹 Copy & sort
Next, every key of the map is copied and sorted (array of keys), after which the index (idx) is retrieved of last (current) price.
copyK = originalMap.keys().copy()
copyK.sort()
idx = copyK.binary_search_leftmost(src)
Then left and right side of idx is investigated to show a maximum amount of lines at both sides of last price.
🔹 New map & display
The keys (from sorted array of copied keys) that will be displayed are put in a new map, with the associated volume values from the original map.
newMap = map.new()
🔹 Re-cap
• put in original amp (price key, volume value)
• copy & sort
• find index of last price
• fetch relevant keys left/right from that index
• put keys in new map and fetch volume associated with these keys (from original map)
Simple example (only show 5 lines)
bar 0, price = 2, volume = 23
bar 1, price = 4, volume = 3
bar 2, price = 8, volume = 21
bar 3, price = 6, volume = 7
bar 4, price = 9, volume = 13
bar 5, price = 5, volume = 85
bar 6, price = 3, volume = 13
bar 7, price = 1, volume = 4
bar 8, price = 7, volume = 9
Original map:
Copied keys array:
Sorted:
-> 5 keys around last price (7) are fetched (5, 6, 7, 8, 9)
-> keys are placed into new map + volume values from original map
Lastly, these values are displayed.
🔶 SETTINGS
Source : Set source of choice; default close , can be set as high , low , open , ...
Volume & currency : Enable to multiply volume with price (see Features )
Amount of bars : Set amount of bars which you want to include in the Volume Profile
Max lines : maximum 1000 (if you want to use only lines, and no boxes -> max. 500, see Concepts )
🔹 Round -> ' Round/Step '
Round -> see Concepts
Step -> see Concepts
🔹 Display Volume Profile
Offset: shifts the Volume Profile (max. 500 bars to the right of last bar, see Features )
Max width Volume Profile: largest volume will be x bars wide, the rest is displayed as a ratio against largest volume (see Features )
Show table : Show details (see Features )
🔶 LIMITATIONS
• Lines won't go further than first bar (coded).
• The Volume Profile can be placed maximum 500 bar to the right of last price.
• Maximum 500 lines/boxes can be displayed

Historic Volume/Market ProfilesHistoric Volume/Market Profile is a Periodic Volume Profile with all of the improvements known in the original Volume/Market Profile.
VMP is a 2 in 1 Volume and Market Profile Indicator.
HVMP uses the base of VMP to offer a quick and simple view at multiple historic profiles at the same time.
This includes:
Cluster Identification for High Volume and Low Volume Areas.
Maximizing granularity by utilizing boxes and lines to get up to 1000 rows.
New Inclusions in HVMP vs VMP:
HVMP granularity is determined by the # of profiles on display. By doing this, each profile will get an even amount of allocated rows to use and granularity is scaled per-profile, to fit within the row allowance.
For Example: 1000/(# of profiles) = Maximum # of rows per profile.
HVMP introduces the "Auto-Scale" Option (on by Default), this automatically fits each profile within the defined timeframe period to provide a consistent display when switching timeframes.
Even with "Auto-Scale" enabled, "Display Size" dictates which direction the profile is displayed.
Below is a Negative Display Size (Displays from right to left, starting at the end of the period)
Below is a Positive Display Size (Displays from left to right, starting at the beginning of the period)
HVMP is only for historical data, you can get a live profile with the same Node Identification using VMP (Volume Market/Profile). The indicator that this one is based on.
Find it Here: Volume/Market Profile
Enjoy!

Volume Profile Bar-Magnified Order Blocks [MyTradingCoder]Introducing "Volume Profile Bar-Magnified Order Blocks", an innovative and unique trading indicator designed to provide traders with a comprehensive understanding of market dynamics. This tool takes the concept of identifying order blocks on your chart and elevates it by integrating a detailed volume profile within each order block zone.
Unlike standard order block indicators, Volume Profile Bar-Magnified Order Blocks pulls data from lower timeframe bars and assigns it to various segments of the order block. By providing this volume profile inside the order block, the indicator supplies a deeper, multi-dimensional view of market activity that can enhance your trading decisions.
Crucially, users have the ability to fine-tune the detection of order blocks. This is made possible through a single input setting called "Tuning". This integer value allows you to control the significance and frequency of the order blocks. Higher numbers will produce more significant order blocks, though they will appear less frequently. Lower numbers, on the other hand, will yield less significant order blocks, but they will occur more often. This enables you to adjust the sensitivity of the indicator according to your specific trading strategy and style.
Key Settings:
Number of Segments: Customize the level of detail in your volume profile by selecting the number of segments you want inside each order block.
Tuning: Adjust the sensitivity of order block detection to align with your trading strategy. Higher values produce more significant but less frequent order blocks, while lower values yield less significant but more frequent order blocks.
Color Inputs: Personalize the look of your chart by selecting the colors for various elements of the indicator. This ensures a seamless integration with your current chart aesthetics and improves visual clarity.
Here is a s creenshot that beautifully demonstrates the power of this indicator. You'll see how the price rejects perfectly off the highest volume segment in an order block, showcasing the indicator's potential for pinpointing high-impact price levels.
While Volume Profile Bar-Magnified Order Blocks offers many unique features, it should be used in conjunction with other indicators and forms of analysis for a complete trading strategy. As with all tools, it does not guarantee profitable trades but is intended to give traders more information to base their decisions on. Use it to complement your existing analysis and enhance your understanding of market behavior.
Experience a new level of clarity in your trading with Volume Profile Bar-Magnified Order Blocks - an indicator that goes beyond the surface to help you navigate the markets more effectively.

Volume Profile Regression Channel [LuxAlgo]The Volume Profile Regression Channel calculates a volume profile from an anchored linear regression channel. Users can choose the starting and ending points for the indicator calculation interval.
Like a regular volume profile, a "line" of control (LOC), value area, and a developing LOC are displayed.
🔶 SETTINGS
Sections: The number of sections the linear regression channel is divided into for the calculation of the volume profile.
Width %: Determines the length of the profile within the channel relative to the channel length.
Value Area %: Highlights the sections starting from the POC whose accumulated volume is equal to the user-defined percentage of the total profile sections volume.
🔶 USAGES
Regular volume profiles are often constructed from a horizontal price area, this can allow highlighting price areas where most trading activity takes place.
However, when price is strongly trending a classical volume profile can sometimes be more uniform. This is where using an angled volume profile can be useful.
The line of control allows highlighting the section of the channel with the most accumulated volume, this line can be used as a potential future support/resistance. This is where an angled volume profile might be the most useful.
The developing LOC highlights the LOC location at a specific time within the profile (from left to right) and can sometimes provide an estimate of the underlying trend in the price.
🔶 DETAILS
To be computed the script requires a left and right chart time coordinates. When adding the script to their charts users can determine the left and right time coordinates by clicking on the chart.
The linear regression channel width is determined so that the channel precisely encompasses the whole price.
🔶 LIMITATIONS
Using a very large calculation interval can return timeouts. Users can reduce the calculation interval to fix that issue from occurring.
The amount of drawing objects that can be used is limited, as such using a high calculation interval can display an incomplete profile.
🔶 ACKNOWLEDGEMENTS
If you are interested in these types of scripts, @HeWhoMustNotBeNamed published a similar script where users can use a custom line angle. See his 'Angled Volume Profile' script from March 2023.

Volume Profile Matrix [LuxAlgo]The Volume Profile Matrix indicator extends from regular volume profiles by also considering calculation intervals within the calculation window rather than only dividing the calculation window in rows.
Note that this indicator is subject to repainting & back-painting, however, treating the indicator as a tool for identifying frequent points of interest can still be very useful.
🔶 SETTINGS
Lookback: Number of most recent bars used to calculate the indicator.
Columns: Number of columns (intervals) used to calculate the volume profile matrix.
Rows: Number of rows (intervals) used to calculate the volume profile matrix.
🔶 USAGE
The Volume Profile Matrix indicator can be used to obtain more information regarding liquidity on specific time intervals. Instead of simply dividing the calculation window into equidistant rows, the calculation is done through a grid.
Grid cells with trading activity occurring inside them are colored. More activity is highlighted through a gradient and by default, cells with a color that are closer to red indicate that more trading activity took place within that cell. The cell with the highest amount of trading activity is always highlighted in yellow.
Each interval (column) includes a point of control which highlights an estimate of the price level with the highest traded volume on that interval. The level with the highest traded volume of the overall grid is extended to the most recent bar.

Bar Magnified Volume Profile/Fixed Range [ChartPrime]This indicator draws a volume profile by utilizing data from the lower timeframe to get a more accurate representation of where volume occurred on a bar to bar basis. The indicator creates a price range, and then splits that price range into 100 grids by default. The indicator then drops down to the lower timeframe, approximately 16 times lower than the current timeframe being viewed on the chart, and then parses through all of the lower timeframe bars, and attributes the lower timeframe bar volume to all grids that it is touching. The volume is dispersed proportionally to the grids which it is touching by whatever percent of the candle is inside each grid. For example, if one of the lower timeframe bars is interacting with "2" of the grids in the profile, and 60% of the candle is inside of the top grid, 60% of the volume from said candle will be attributed to the grid.
To make all of this magic happen, this script utilizes a quadratic time complexity algorithm while parsing and attributing the volume to all of the grids. Due to this type of algorithm being used in the script, many of the user inputs have been limited to allow for simplicity, but also to prevent possible errors when executing loops. For the most part, all of the settings have been thoroughly tested and configured with the right amount of limitations to prevent these errors, but also still give the user a broad range of flexibility to adjust the script to their liking.
📗 SETTINGS
Lookback Period: The lookback period determines how many bars back the script will search for the "highest high" and the "lowest low" which will then be used to generate the grids in-between
Number Of Levels: This setting determines how many grids there will be within the volume profile/fixed range. This is personal preference, however it is capped at 100 to prevent time complexity issues
Profile Length: This setting allows you to stretch or thin the volume profile. A higher number will stretch it more, vise versa a smaller number will thin it further. This does not change the volume profiles results or values, only its visual appearance.
Profile Offset: This setting allows you to offset the profile to the left or right, in the event the user does not appreciate the positioning of the default location of the profile. A higher number will shift it to the right, vise versa a lower number will shift it to the left. This is personal preference and does not affect the results or values of the profile.
🧰 UTILITY
The volume profile/fixed range can be used in many ways. One of the most popular methods is to identify high volume areas on the chart to be used as trade entries or exits in the event of the price revisiting the high volume areas. Take this picture as an example. The image clearly demonstrates how the 2 highest areas of volume within this magnified volume profile also line up to great areas of support and resistance in the market.
Here are some other useful methods of using the volume profile/fixed range
Identify Key Support and Resistance Levels for Setups
Determine Logical Take Profits and Stop Losses
Calculate Initial R Multiplier
Identify Balanced vs Imbalanced Markets
Determine Strength of Trends

Open DriveOpen Drive is a market profile concept introduced by Jim Dalton. It occurs when the price moves directionally and persistently for the first 30 minutes from the cash market open.
It is necessary to use 30-minute bars as there needs to be enough time to measure an extreme move of the cash open. This means there will be fewer trades than other strategies using faster time periodicities.
The script finds open drives from these time points 0700/ 0800 and 1300/1430.
The entry signal also has a breakout threshold using the 5-bar high and 5-bar low to only take trades moving away from the prior 5-bar range. This weeds out most mid-range trades and small range expansion bars.
If the price has had a strong move from the open and has broken either below the prior 5-bar low or above the prior 5-bar high by an amount equal to the prior 5-bar range a trade is entered in the direction of the move.
The Exit criteria; exit after 3 bars which is 90mins when using a 30min periodicity.
Note, this script is shared to show that momentum generated on or around the cash open tends to persist. The entry and exits of this strategy are quite naive but there are plenty of ways to take more aggressive entries on faster time frames when an open drive occurs. The times chosen for this strategy will suit stock index futures mainly. The user can experiment with other futures products and their corresponding pit/ cash open hours.
Google "open drive market profile" for more information on open drives and market profile concepts.
Happy trading!
