OPEN-SOURCE SCRIPT
Equity chart [LM]
Hey Guys,
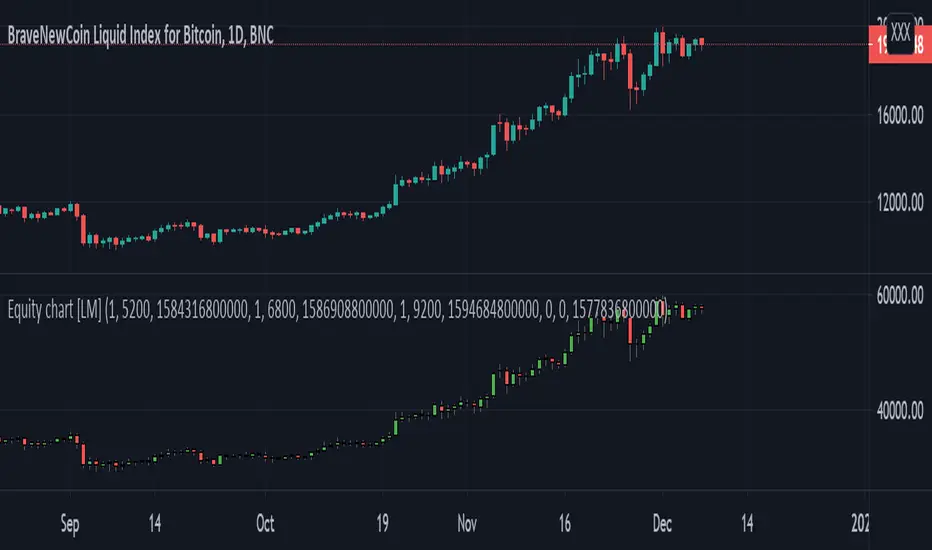
I have created draft version of chart where you can put your position amount and position price and position date for each entry and it will chart your equity as candle stick chart. There are currently possible to include 4 positions but you can add as many you like by modyfing the code.
It will calculate your average entry based on your input and in date where you add other entry it will create gap. I have already plan to include there also leverage on each position. The idea is that you should trade your equity and with this indicator you will be able to create your custom indicator based on equity chart and not price chart.
!! Unless you will enter position nothing will be rendered
Indicator is under breadth indicator because didn't know where to put it.
I release this script for collaboration and improving the idea with new features
Cheers,
Lukas
Skrip sumber terbuka
Dalam semangat sebenar TradingView, pencipta skrip ini telah menjadikannya sumber terbuka supaya pedagang dapat menilai dan mengesahkan kefungsiannya. Terima kasih kepada penulis! Walaupun anda boleh menggunakannya secara percuma, ingat bahawa menerbitkan semula kod ini adalah tertakluk kepada Peraturan Dalaman kami.
Penafian
Maklumat dan penerbitan adalah tidak dimaksudkan untuk menjadi, dan tidak membentuk, nasihat untuk kewangan, pelaburan, perdagangan dan jenis-jenis lain atau cadangan yang dibekalkan atau disahkan oleh TradingView. Baca dengan lebih lanjut di Terma Penggunaan.