Siege Trade Indicator
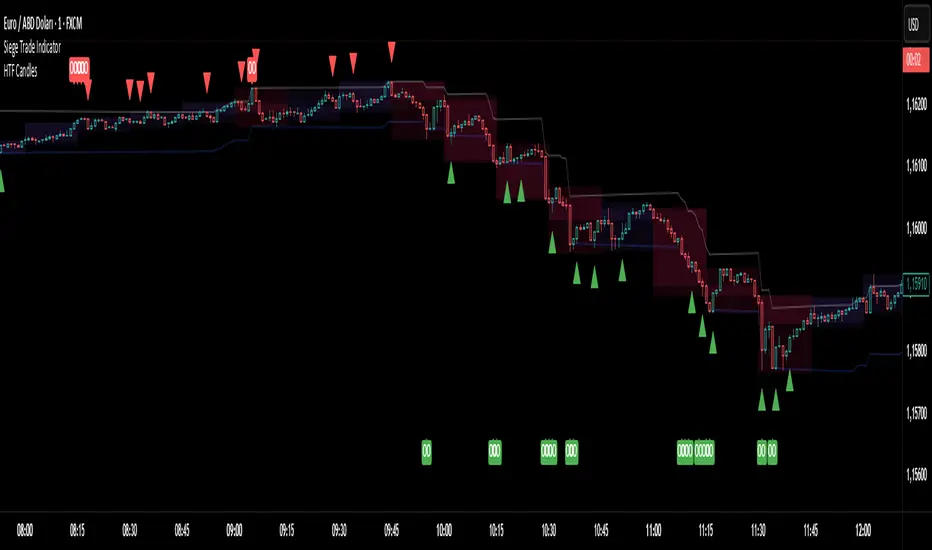
This indicator integrates RSI, Pivot Points, and trend-following features into a single view to create a powerful trading strategy. It is an ideal tool for traders who want to both catch trends and identify potential reversals and overbought/oversold regions.
Key Features
- RSI (Relative Strength Index): Shows whether the price has reached overbought or oversold territories. Specific RSI levels (e.g., above 70 and below 30) serve as a warning for potential buy/sell signals.
- Pivot Points: Automatically plots support and resistance levels on the chart, calculated on a daily, weekly, or monthly basis. These levels help you identify key points where the price might react.
- Trend Following: Determines the direction of the trend based on price movements and provides clues about its strength. This feature helps reduce the risk of trading against the trend, allowing you to take positions aligned with the current market direction.
How to Use
This indicator is not designed to be a standalone buy/sell signal tool. For the most accurate results, it is recommended to use it in conjunction with different timeframes and your own technical analysis. For instance, when the price approaches a pivot support and the RSI enters the oversold region, it can be considered a potential signal for the start of an uptrend.
This indicator provides strong support for deepening your market analysis and making more informed decisions. For more details...
Skrip jemputan sahaja
Hanya pengguna yang diluluskan oleh penulis boleh mengakses skrip ini. Anda perlu memohon dan mendapatkan kebenaran untuk menggunakannya. Ini selalunya diberikan selepas pembayaran. Untuk lebih butiran, ikuti arahan penulis di bawah atau hubungi terus ahmedturker.
TradingView tidak menyarankan pembayaran untuk atau menggunakan skrip kecuali anda benar-benar mempercayai penulisnya dan memahami bagaimana ia berfungsi. Anda juga boleh mendapatkan alternatif sumber terbuka lain yang percuma dalam skrip komuniti kami.
Arahan penulis
Amaran: sila baca panduan kami untuk skrip jemputan sahaja sebelum memohon akses.
Penafian
Skrip jemputan sahaja
Hanya pengguna yang diluluskan oleh penulis boleh mengakses skrip ini. Anda perlu memohon dan mendapatkan kebenaran untuk menggunakannya. Ini selalunya diberikan selepas pembayaran. Untuk lebih butiran, ikuti arahan penulis di bawah atau hubungi terus ahmedturker.
TradingView tidak menyarankan pembayaran untuk atau menggunakan skrip kecuali anda benar-benar mempercayai penulisnya dan memahami bagaimana ia berfungsi. Anda juga boleh mendapatkan alternatif sumber terbuka lain yang percuma dalam skrip komuniti kami.
Arahan penulis
Amaran: sila baca panduan kami untuk skrip jemputan sahaja sebelum memohon akses.