Blockcircle Waveform Bands
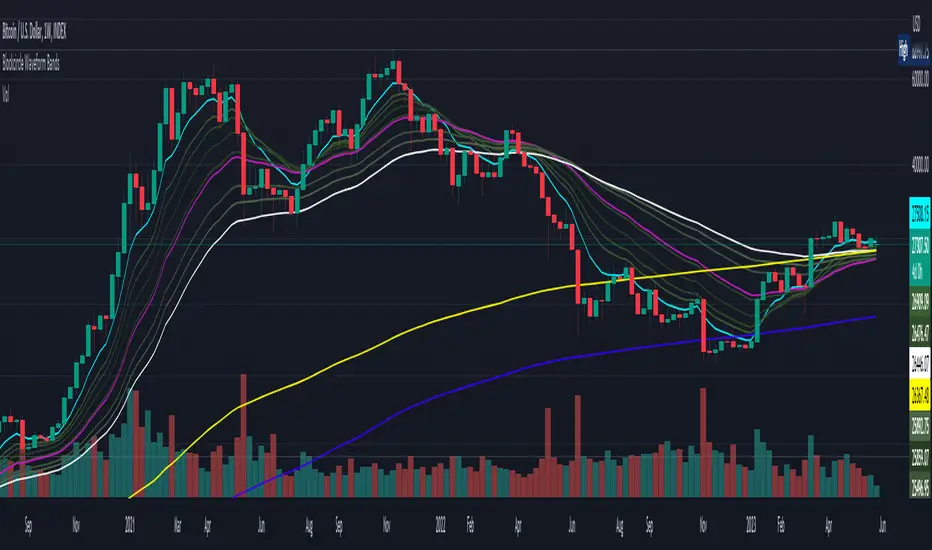
This comprehensive indicator combines the benefits of both lagging and leading indicators, with SMAs providing a more stable overview of historical price trends, while EMAs respond more swiftly to recent price movements. Users can easily configure the exact periods for each moving average in the indicator's parameter settings, tailoring the tool to their individual preferences and trading strategies.
Understanding the relationship between various moving averages, such as the 10-Day SMA and 50-Day SMA, or the 1-Day and 10-Day SMA, allows traders to gauge short-term trends relative to long-term trends. For instance, when the 10-Day SMA crosses above the 50-Day SMA, it may signal a bullish trend, whereas a cross below the 50-Day SMA might indicate a bearish market.
Similarly, examining the connection between the 1-Week SMA and the 200-Week SMA can provide valuable information on long-term trends and potential trend reversals, further enhancing traders' abilities to make informed decisions.
We, at Blockcircle, like to say that "easy mode" is when the current price is decisively closing above the 8 Month EMA and has successfully retested that level, at that point, we typically have a few months of blissful green up and up
It is important to pay particularly close attention to the relationship of the 8EMA and the 30EMA and the 60EMA, and crossover between the current daily close price and those bands
Skrip jemputan sahaja
Hanya pengguna disahkan oleh penulis boleh mengakses skrip ini. Anda perlu memohon dan mendapatkan kebenaran untuk menggunakannya. Keizinan selalunya diberikan selepas pembayaran. Untuk lebih butiran, ikuti arahan penulis di bawah atau hubungi blockcircle secara terus.
Ambil maklum bahawa skrip peribadi dan jemputan sahaja ini masih belum disemak oleh moderator skrip dan pematuhannya dengan Peraturan Dalaman adalah belum ditentukan. TradingView TIDAK menyarankan pembayaran atau penggunaan skrip kecuali anda mempercayai sepenuhnya penulis dan memahami bagaimana ia berfungsi. Anda juga boleh menjumpai alternatif sumber terbuka dan percuma yang lain di dalam skrip komuniti kami.
Arahan penulis
Penafian
Skrip jemputan sahaja
Hanya pengguna disahkan oleh penulis boleh mengakses skrip ini. Anda perlu memohon dan mendapatkan kebenaran untuk menggunakannya. Keizinan selalunya diberikan selepas pembayaran. Untuk lebih butiran, ikuti arahan penulis di bawah atau hubungi blockcircle secara terus.
Ambil maklum bahawa skrip peribadi dan jemputan sahaja ini masih belum disemak oleh moderator skrip dan pematuhannya dengan Peraturan Dalaman adalah belum ditentukan. TradingView TIDAK menyarankan pembayaran atau penggunaan skrip kecuali anda mempercayai sepenuhnya penulis dan memahami bagaimana ia berfungsi. Anda juga boleh menjumpai alternatif sumber terbuka dan percuma yang lain di dalam skrip komuniti kami.