OPEN-SOURCE SCRIPT
Telah dikemas kini CARNAC Trading Support and Resistance Levels

Overview
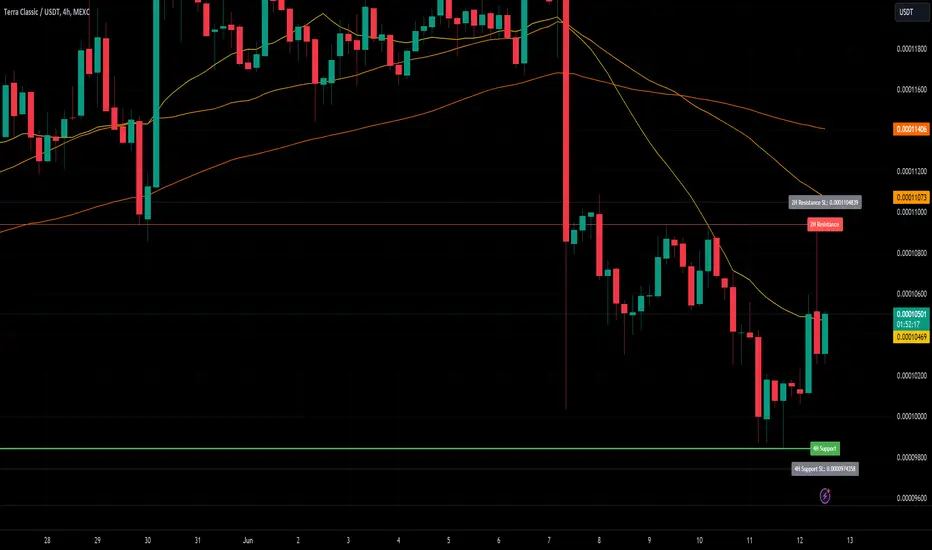
The "Carnac Trading Support and Resistance Levels" indicator is a powerful tool designed to help traders identify key support and resistance levels across multiple timeframes. This tool enhances trading strategies by visually marking significant price levels and providing configurable stop-loss and alert features.
Features
Support and Resistance Levels: Automatically calculates and plots support and resistance levels for the following timeframes:
Configurable Stop-Loss (SL) Levels: Adds a stop-loss line below each support level and above each resistance level with customizable padding (as a percentage).
Visual Labels: Clearly labels support, resistance, and stop-loss levels with the corresponding prices and timeframes for easy identification.
Line Customization:
Alerts: Alerts trigger when the price gets to a configurable percentage from the support or resistance levels, helping you stay informed about potential buying and selling opportunities.
Visibility Toggling: Easily toggle the visibility of support and resistance levels for each timeframe (default enabled for 2H, 4H, and 1D).
How to Use
Add the Indicator:
Configure Inputs:
Interpret the Plotted Levels:
Identifying Buying and Selling Opportunities:
Buying Opportunities:
Selling Opportunities:
Alerts:
The "Carnac Trading Support and Resistance Levels" indicator is a powerful tool designed to help traders identify key support and resistance levels across multiple timeframes. This tool enhances trading strategies by visually marking significant price levels and providing configurable stop-loss and alert features.
Features
Support and Resistance Levels: Automatically calculates and plots support and resistance levels for the following timeframes:
- 5 minutes (5M)
- 10 minutes (10M)
- 15 minutes (15M)
- 30 minutes (30M)
- 1 hour (1H)
- 2 hours (2H)
- 4 hours (4H)
- 6 hours (6H)
- 12 hours (12H)
- 1 day (1D)
- 1 week (1W)
- 1 month (1M)
Configurable Stop-Loss (SL) Levels: Adds a stop-loss line below each support level and above each resistance level with customizable padding (as a percentage).
Visual Labels: Clearly labels support, resistance, and stop-loss levels with the corresponding prices and timeframes for easy identification.
Line Customization:
- Support Levels: Green lines with varying thickness based on the timeframe.
- Resistance Levels: Red lines with varying thickness based on the timeframe.
- Stop-Loss Levels: Gray dotted lines for clear distinction.
Alerts: Alerts trigger when the price gets to a configurable percentage from the support or resistance levels, helping you stay informed about potential buying and selling opportunities.
Visibility Toggling: Easily toggle the visibility of support and resistance levels for each timeframe (default enabled for 2H, 4H, and 1D).
How to Use
Add the Indicator:
- Navigate to the TradingView Pine Editor.
- Paste the provided Pine Script code and click "Add to Chart."
Configure Inputs:
- Lookback Periods: Adjust the lookback periods for each timeframe to suit your analysis needs.
- Padding Percentage: Set the padding percentage for the stop-loss levels to define the distance below the support levels and above the resistance levels.
- Visibility: Toggle the visibility of the support and resistance levels for each timeframe as needed (default enabled for 2H, 4H, and 1D).
- Alert Trigger Distance: Set the alert trigger distance as a percentage to determine when the alerts should be triggered.
Interpret the Plotted Levels:
- Green Lines: Indicate support levels for the respective timeframes.
- Red Lines: Indicate resistance levels for the respective timeframes.
- Gray Dotted Lines: Represent the stop-loss levels below each support level and above each resistance level, with the specified padding.
- Labels: Provide clear indications of the price levels and their respective timeframes in white text for visibility.
Identifying Buying and Selling Opportunities:
Buying Opportunities:
- Look for the price to approach or bounce off a support level (green line).
- Confirm the potential for a reversal by checking if the price is nearing a key support level from multiple timeframes.
- Use the stop-loss level (gray dotted line) to set your stop-loss order below the support level to minimize risk.
Selling Opportunities:
- Look for the price to approach or get rejected at a resistance level (red line).
- Confirm the potential for a reversal by checking if the price is nearing a key resistance level from multiple timeframes.
- Use the stop-loss level (gray dotted line) to set your stop-loss order above the resistance level to minimize risk.
Alerts:
- Alerts will notify you when the price gets within the specified percentage distance from each support or resistance level.
- Use these alerts to stay informed about potential buying and selling opportunities.
Nota Keluaran
Added a setting to enable/disable the current bar from being used in the calculation of the support and resistance levels. This prevents some live re-painting issues when a candle is breaking support or resistance.Nota Keluaran
Made adjustments to help reduce re-painting.Nota Keluaran
Global SL Level Toggle:Users can now globally toggle the visibility of the Stop-Loss (SL) levels, making it easier to manage chart clutter.
Individual Support/Resistance Toggles:
Each timeframe now has independent toggles for support and resistance levels. This provides users with more granular control over their charts, allowing them to display only the relevant levels for their trading strategy.
Skrip sumber terbuka
Dalam semangat TradingView sebenar, pencipta skrip ini telah menjadikannya sumber terbuka, jadi pedagang boleh menilai dan mengesahkan kefungsiannya. Terima kasih kepada penulis! Walaupuan anda boleh menggunakan secara percuma, ingat bahawa penerbitan semula kod ini tertakluk kepada Peraturan Dalaman.
Penafian
Maklumat dan penerbitan adalah tidak bertujuan, dan tidak membentuk, nasihat atau cadangan kewangan, pelaburan, dagangan atau jenis lain yang diberikan atau disahkan oleh TradingView. Baca lebih dalam Terma Penggunaan.