OPEN-SOURCE SCRIPT
Telah dikemas kini DVDIQQE [DW]
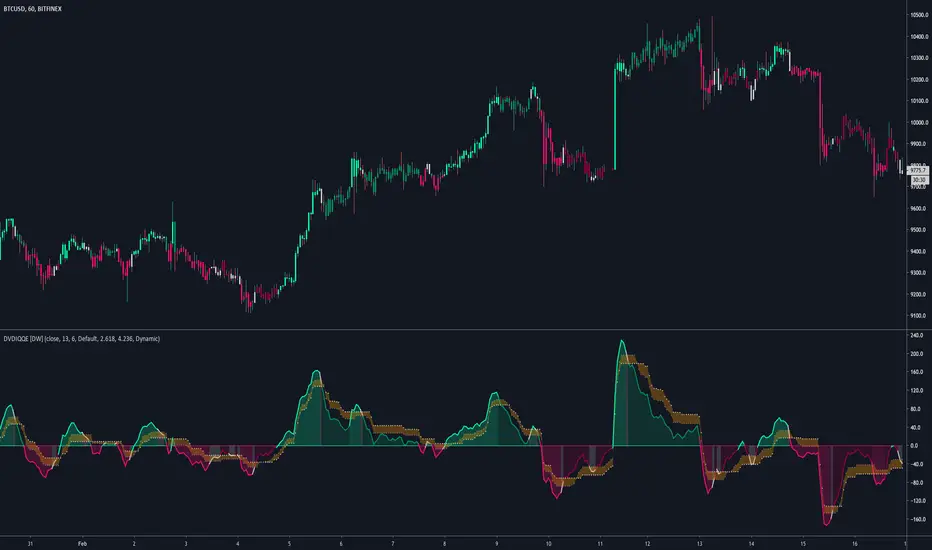
This is an experimental study inspired by the Quantitative Qualitative Estimation indicator designed to identify trend and wave activity.
In this study, rather than using RSI for the calculation, the Dual Volume Divergence Index oscillator is utilized.
First, the DVDI oscillator is calculated by taking the difference between PVI and its EMA, and NVI and its EMA, then taking the difference between the two results.
Optional parameters for DVDI calculation are included within this script:
- An option to use tick volume rather than real volume for the volume source
- An option to use cumulative data, which sums the movements of the oscillator from the beginning to the end of TradingView's maximum window to give a more broad picture of market sentiment
Next, two trailing levels are calculated using the average true range of the oscillator. The levels are then used to determine wave direction.
Lastly, rather than using 0 as the center line, it is instead calculated by taking a cumulative average of the oscillator.
Custom bar colors are included.
Note: For charts that have no real volume component, use tick volume as the volume source.
Nota Keluaran
Updates:Migrated from pine v2 to v3. Adjusted the equations accordingly.
Changed default smoothing period to 6.
Nota Keluaran
Updates:-> Migrated to v4.
-> Updated DVDI function.
-> Corrected NaN values to stabilize initial conditions.
-> Added the option to choose between a static or dynamic center line. When the line is static, its value is 0.
-> Reorganized script structure.
-> Revamped color scheme.
Skrip sumber terbuka
Dalam semangat TradingView sebenar, pencipta skrip ini telah menjadikannya sumber terbuka, jadi pedagang boleh menilai dan mengesahkan kefungsiannya. Terima kasih kepada penulis! Walaupuan anda boleh menggunakan secara percuma, ingat bahawa penerbitan semula kod ini tertakluk kepada Peraturan Dalaman.
For my full list of premium tools, check the blog:
wallanalytics.com/
Reach out on Telegram:
t.me/DonovanWall
wallanalytics.com/
Reach out on Telegram:
t.me/DonovanWall
Penafian
Maklumat dan penerbitan adalah tidak bertujuan, dan tidak membentuk, nasihat atau cadangan kewangan, pelaburan, dagangan atau jenis lain yang diberikan atau disahkan oleh TradingView. Baca lebih dalam Terma Penggunaan.