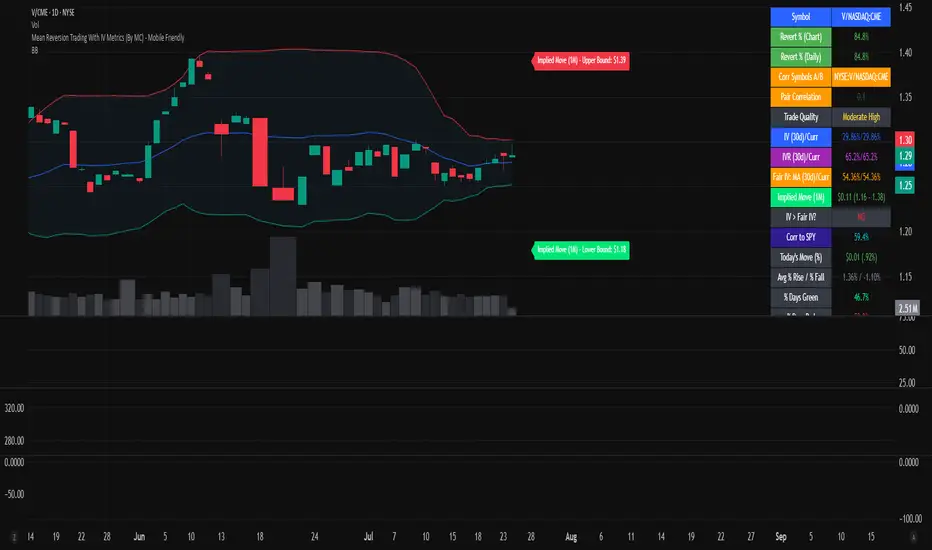
Mean Reversion Trading With IV Metrics (By MC) - Mobile Friendly
Key Features & How They Work Together
1. Mean Reversion Probability & Z-Score
- Mean Reversion Analysis: Calculates z-scores and statistical probabilities that the asset’s price will revert to its mean, using customizable lookback windows (e.g., 10-60 bars). This helps traders spot potentially overbought or oversold conditions.
- Strong & Moderate Signals: Highlights strong and moderate reversion opportunities based on user-defined probability thresholds, providing clear visual cues for timing entries and exits.
2. Paired Asset Correlation
- Pairs Trading Support: Allows comparison of two symbols (e.g., SPY vs TLT). It computes the ratio, rolling mean, standard deviation, and correlation, helping traders identify divergence/convergence opportunities in pairs trading.
3. Volatility Metrics & Projections
- Historical & Implied Volatility: Estimates implied volatility (IV) using historical price data, calculates IVR (the asset’s IV relative to its own history), and provides user-customized percentile bands (e.g., 20th/80th percentiles).
- Fair IV Calculation: Offers three methods to compute “fair” volatility:
Market-Aware (relative to VIX/SPX HV)
SMA of historical volatility
SMA of VIX Traders can choose the method that best fits current market conditions. - Future Projections: Projects IV, “Fair” IV, and IVR for a user-defined future period, giving insight into potential volatility trends.
4. Implied Move Range
- Implied Move Calculation: Shows the expected price range (upper/lower bounds) for the forecast period based on the current IV, making risk management and target setting more objective.
- Dynamic Labels: Automatically updates labels with the latest projected moves and bounds, keeping traders informed in real time.
5. Market Volatility Dashboard
- Broad Market Indicators: Displays real-time values and daily changes for VIX, VIX1D, VVIX, MOVE (bond volatility), GVZ (gold volatility), and OVX (oil volatility). Color-coded thresholds help traders gauge market stress across asset classes.
- Correlation to SPY: Shows how closely the asset moves with SPY, aiding in diversification and hedging decisions.
6. Performance Metrics
- Daily Move Analysis: Tracks today’s price move (absolute and percentage), average rises/falls, and the percentage of green/red days over a custom period.
- Trade Quality Assessment: Ranks trade opportunities (High/Moderate/Low/Very Low) based on mean reversion probability.
7. Highly Customizable Table
- Mobile Friendly: The stats table can be placed anywhere on the chart, toggled between compact/full/extra modes, and resized for readability on any device.
- Visual Cues: Color coding and dynamic labels make interpretation easy and fast.
8. Alert Conditions
- Built-in alerts for strong/moderate mean reversion, IV crossing above/below “Fair” IV, allowing proactive trade management.
9. VIX-Based Expected Move Bands
- Optionally plots ±1, 2, 3 standard deviation bands using VIX-based expected move, helping to visualize potential price extremes.
How These Features Help Traders
- Unified Trading Dashboard: All key mean reversion and volatility insights are available at a glance, reducing the need to switch between multiple indicators or screens.
- Informed Entries & Exits: By combining mean reversion probabilities, IV projections, and market volatility, traders can time trades more confidently and avoid false signals.
- Risk Management: The implied move bounds and volatility levels support realistic stop-loss and target setting, adapting dynamically to market conditions.
- Cross-Asset Awareness: Market-wide volatility metrics and asset correlation to SPY provide context, helping traders avoid surprises from macro shocks.
- Pairs Trading: Direct support for ratio and correlation analysis streamlines pairs strategies.
- Customization & Clarity: The flexible UI and color-coded stats make the tool accessible for both beginners and advanced users.
Mean Reversion, Correlation value & interpretation:
For Meant Reversion % Probability:
Lookback Period to use:
| Trading Horizon | Lookback Period (Length) | Rationale |
| 5–10 days | 10–20 bars | More sensitive, good for quick reversals |
| 10–20 days | 20–30 bars | Standard for short swing |
| 20–40 days | 40–60 bars | More stable mean for longer swing |
Interpretation Guide:
Only consider trades if Correlation ≥ 0.6 or Reversion % ≥ 75%.
Avoid trades with Reversion % < 20%.
Correlation and Reversion % together form a powerful trade quality filter.
| Reversion % | Correlation | Signal Strength | Action |
| ≥ 75% | ≥ 0.4 | High Probability | Consider full position |
| ≥ 50% | ≥ 0.6 | Moderate Probability | Trade with standard size |
| ≥ 75% | < 0.4 | Uncorrelated Edge | Trade small or hedge carefully |
| < 50% | Any | Weak | Avoid |
| Any | < 0.3 | Low Coherence | Avoid unless extreme Reversion |
| Correlation Value | Interpretation |
| +1.0 | Perfect positive correlation (price of both move in the same direction)|
| +0.7 to +0.9 | Strong positive correlation |
| +0.4 to +0.6 | Moderate positive correlation |
| 0 | No correlation (independent) |
| -0.4 to -0.6 | Moderate negative correlation |
| -0.7 to -0.9 | Strong negative correlation |
| -1.0 | Perfect negative correlation (price both move in the opposite direction)|
Summary:
This script empowers traders to navigate markets with a robust, data-driven approach, seamlessly blending mean reversion analytics with deep volatility insight—all in a mobile-friendly, customizable dashboard.
Disclaimer
This tool is for informational and educational purposes only. It does not provide financial advice or trading signals. Always do your own research and consult a professional before making investment decisions.
Skrip jemputan sahaja
Hanya pengguna disahkan oleh penulis boleh mengakses skrip ini. Anda perlu memohon dan mendapatkan kebenaran untuk menggunakannya. Keizinan selalunya diberikan selepas pembayaran. Untuk lebih butiran, ikuti arahan penulis di bawah atau hubungi mclee1.2006 secara terus.
TradingView TIDAK menyarankan pembayaran atau penggunaan skrip kecuali anda mempercayai sepenuhnya penulis dan memahami bagaimana ia berfungsi. Anda juga boleh menjumpai alternatif sumber terbuka dan percuma yang lain di dalam skrip komuniti kami.
Arahan penulis
Penafian
Skrip jemputan sahaja
Hanya pengguna disahkan oleh penulis boleh mengakses skrip ini. Anda perlu memohon dan mendapatkan kebenaran untuk menggunakannya. Keizinan selalunya diberikan selepas pembayaran. Untuk lebih butiran, ikuti arahan penulis di bawah atau hubungi mclee1.2006 secara terus.
TradingView TIDAK menyarankan pembayaran atau penggunaan skrip kecuali anda mempercayai sepenuhnya penulis dan memahami bagaimana ia berfungsi. Anda juga boleh menjumpai alternatif sumber terbuka dan percuma yang lain di dalam skrip komuniti kami.