OPEN-SOURCE SCRIPT
Candle count, with simple number
What it does
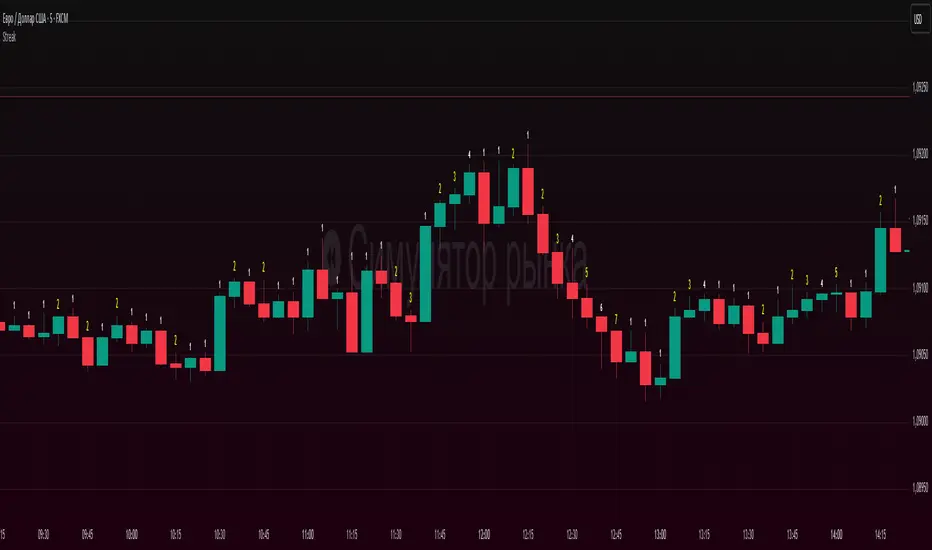
Counts the length of same-color candle streaks (consecutive bullish or bearish bars) and prints the running number above each bar:
e.g., “1, 2, 3…”; when color flips, it restarts at “1”.
Prime numbers (2, 3, 5, 7, 11, 13) are emphasized by rendering one size step larger and with a user-selected color.
Labels are pinned to each bar (anchored by bar index and price), so they do not drift when you pan or zoom the chart.
How it works
Determines candle direction: bullish if close > open, bearish if close < open.
If the current bar has the same direction as the previous bar, the counter increments; otherwise it resets to 1.
For values 2, 3, 5, 7, 11, 13 the number is highlighted (bigger + custom color).
Each number is drawn just above the bar’s High with a configurable offset.
The script does not repaint on history. During the live bar, the number updates in real time (as expected).
Settings
Digits size — Base text size (Tiny / Small / Normal / Large / Huge).
Prime numbers are automatically shown one step larger than the base size.
Offset above bar (ticks) — Vertical offset from the bar’s High, in instrument ticks.
Prime numbers color — Text color used specifically for prime numbers (non-prime digits are white).
How to read & use it
Rising momentum. Long streaks (e.g., 5–7+) suggest strong directional moves with few pullbacks.
Early pause/mean-reversion hints. After a long streak, the appearance of the opposite color (counter resets to “1”) often coincides with a pause or minor retrace.
Research & statistics. Quickly see which streak lengths are common on your market/timeframe (e.g., “How often do 3–5 bar runs occur?”).
Trade management. You can tie partial exits to specific streak lengths (2, 3, 5…) or reduce risk when the counter flips back to “1”.
Why it’s useful
Provides a clean, numeric view of momentum with zero smoothing or lag.
Works on any symbol and timeframe.
Prime-number emphasis makes important counts pop at a glance.
Pinned labels stay exactly above their bars, ensuring stable, readable visuals at any zoom level.
Notes
Doji bars (close == open) are treated as no direction and reset the streak.
This is a context tool, not a standalone buy/sell signal. Combine it with your entry/exit framework.
Very dense charts may hit platform label limits; the script raises the limit, but extremely long histories on very low timeframes can still be heavy.
Skrip sumber terbuka
Dalam semangat TradingView sebenar, pencipta skrip ini telah menjadikannya sumber terbuka, jadi pedagang boleh menilai dan mengesahkan kefungsiannya. Terima kasih kepada penulis! Walaupuan anda boleh menggunakan secara percuma, ingat bahawa penerbitan semula kod ini tertakluk kepada Peraturan Dalaman.
Penafian
Maklumat dan penerbitan adalah tidak bertujuan, dan tidak membentuk, nasihat atau cadangan kewangan, pelaburan, dagangan atau jenis lain yang diberikan atau disahkan oleh TradingView. Baca lebih dalam Terma Penggunaan.