OPEN-SOURCE SCRIPT
Laplace Momentum Percentile ║ BullVision
🔬 Overview
Laplace Momentum Percentile ║ BullVision is a custom-built trend analysis tool that applies Laplace-inspired smoothing to price action and maps the result to a historical percentile scale. This provides a contextual view of trend intensity, with optional signal refinement using a Kalman filter.
This indicator is designed for traders and analysts seeking a normalized, scale-independent perspective on market behavior. It does not attempt to predict price but instead helps interpret the relative strength or weakness of recent movements.
⚙️ Key Concepts
📉 Laplace-Based Smoothing
🎯 Percentile Mapping
🧠 Optional Kalman Filter
🔧 User Settings
🔁 Transform Parameters
📊 Percentile Settings
🧠 Kalman Filter Controls
🎨 Visual Settings
📈 Visual Output
🧩 Trend Classification Logic
The indicator segments percentile values into five zones:
🔍 Use Cases
This tool is intended as a visual and contextual aid for identifying trend regimes, assessing historical momentum strength, or supporting broader confluence-based analysis. It can be used in combination with other tools or frameworks at the discretion of the trader.
⚠️ Important Notes
Laplace Momentum Percentile ║ BullVision is a custom-built trend analysis tool that applies Laplace-inspired smoothing to price action and maps the result to a historical percentile scale. This provides a contextual view of trend intensity, with optional signal refinement using a Kalman filter.
This indicator is designed for traders and analysts seeking a normalized, scale-independent perspective on market behavior. It does not attempt to predict price but instead helps interpret the relative strength or weakness of recent movements.
⚙️ Key Concepts
📉 Laplace-Based Smoothing
- The core signal is built using a Laplace-style weighted average, applying an exponential decay to price values over a specified length. This emphasizes recent movements while still accounting for historical context.
🎯 Percentile Mapping
- Rather than displaying the raw output, the filtered signal is converted into a percentile rank based on its position within a historical lookback window. This helps normalize interpretation across different assets and timeframes.
🧠 Optional Kalman Filter
- For users seeking additional smoothing, a Kalman filter is included. This statistical method updates signal estimates dynamically, helping reduce short-term fluctuations without introducing significant lag.
🔧 User Settings
🔁 Transform Parameters
- Transform Parameter (s): Controls the decay rate for Laplace weighting.
- Calculation Length: Sets how many candles are used for smoothing.
📊 Percentile Settings
- Lookback Period: Defines how far back to calculate the historical percentile ranking.
🧠 Kalman Filter Controls
- Enable Kalman Filter: Optional toggle.
- Process Noise / Measurement Noise: Adjust the filter’s responsiveness and tolerance to volatility.
🎨 Visual Settings
- Show Raw Signal: Optionally display the pre-smoothed percentile value.
- Thresholds: Customize upper and lower trend zone boundaries.
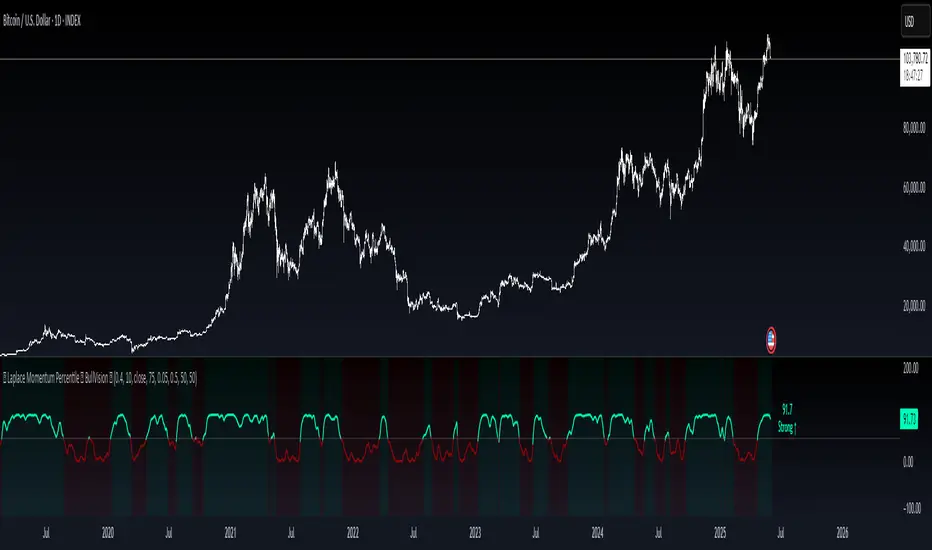
📈 Visual Output
- Main Line: Smoothed percentile rank, color-coded based on strength.
- Raw Line (Optional): The unsmoothed percentile value for comparison.
- Trend Zones: Background shading highlights strong upward or downward regimes.
- Live Label: Displays current percentile value and trend classification.
🧩 Trend Classification Logic
The indicator segments percentile values into five zones:
- Above 80: Strong upward trend
- 50–80: Mild upward trend
- 20–50: Neutral zone
- 0–20: Mild downward trend
- Below 0: Strong downward trend
🔍 Use Cases
This tool is intended as a visual and contextual aid for identifying trend regimes, assessing historical momentum strength, or supporting broader confluence-based analysis. It can be used in combination with other tools or frameworks at the discretion of the trader.
⚠️ Important Notes
- This script does not provide buy or sell signals.
- It is intended for educational and analytical purposes only.
- It should be used as part of a broader decision-making process.
- Past signal behavior should not be interpreted as indicative of future results.
Skrip sumber terbuka
Dalam semangat TradingView sebenar, pencipta skrip ini telah menjadikannya sumber terbuka, jadi pedagang boleh menilai dan mengesahkan kefungsiannya. Terima kasih kepada penulis! Walaupuan anda boleh menggunakan secara percuma, ingat bahawa penerbitan semula kod ini tertakluk kepada Peraturan Dalaman.
🚀 Elevate your edge with institutional-grade indicators & full trading systems.
🔗 Access tools: linktr.ee/0xKazo
🔗 Access tools: linktr.ee/0xKazo
Penafian
Maklumat dan penerbitan adalah tidak bertujuan, dan tidak membentuk, nasihat atau cadangan kewangan, pelaburan, dagangan atau jenis lain yang diberikan atau disahkan oleh TradingView. Baca lebih dalam Terma Penggunaan.