OPEN-SOURCE SCRIPT
Telah dikemas kini [blackcat] L3 Super Best Cost Line
Level: 3
Background
As suggested by hedan1, he made a suggestion: this indicator can be further optimized to develop a dull line to filter the overall direction, and then use the sensitive line as a confirmation signal to enter.
One of my favourite tool to see fast trends which is simple but powerful. It runs under below market logic.
Function
With hedan1's idea, the 1st thing i come up with is a two-layer structure: the inner sensitive part is the best cost line indicator, the outer layer is a supertrend indicator to control the overall trend direction.
Best cost line is a tool to model the people's mood and preference in the market. I define a typical price as wcx, when wcx is above the best cost line, which means traders are willing to use higher price to buy, then if you long, you are following the trend and make profit. On the other hand, if wcx is below the best cost line, which means traders are NOT willing to pursue higher price (maybe due to continous stop loss or sth other), then you should at least not long or if you are agressive in style, you may consider short.
That is it. Do you think it is simple and powerful enough?
Remarks
L: long entry, yellow
XL: close long, fuchsia
S: short entry, green
XS: close short, red
inner bullish: yellow color
inner bearish: fuchsia color
outer bullish: green color
outer bearish: red color
inner indicator : the best cost line
outer indicator : supertrend
also, i improved the display fucntinon remove some blur lines with linebr feature.
Feedbacks are appreciated.
Nota Keluaran
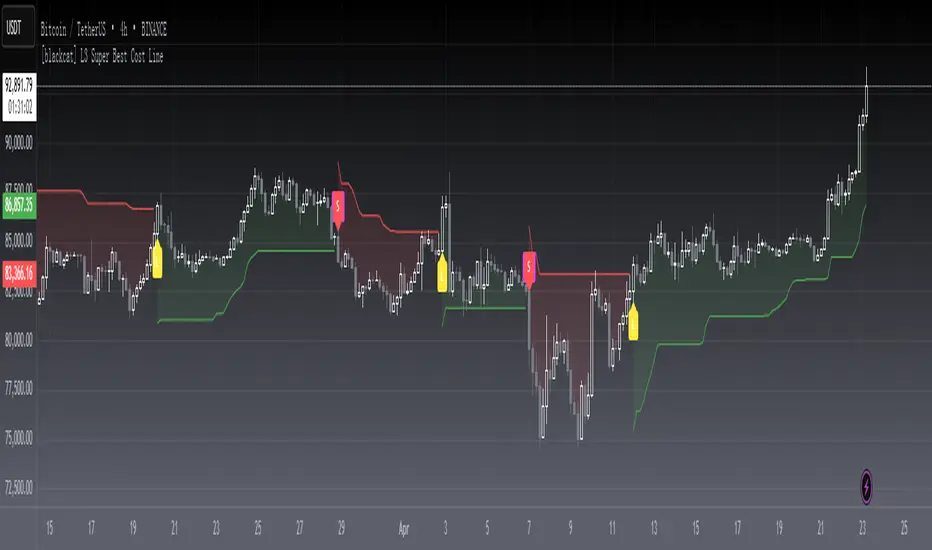
OVERVIEWThe [blackcat] L3 Super Best Cost Line indicator combines elements of technical analysis to help traders identify optimal entry and exit points based on market trends. This script calculates a "Best Cost Line" using typical prices and recent highs/lows, providing clear visual cues for potential buy and sell opportunities. Additionally, it incorporates the Supertrend indicator to enhance trend identification 📈💹.
FEATURES
Calculates Typical Price as an average of key price levels:
Typical Price: (2 * High + Low + Close + Open) / 4.5
Determines recent trends by analyzing highs and lows over specific periods.
Plots the "Best Cost Line" indicating potential support/resistance levels:
Yellow line for bullish trends.
Fuchsia line for bearish trends.
Incorporates the Supertrend Indicator with customizable ATR period and factor:
Green line for upward trends.
Red line for downward trends.
Displays buy ('L'), sell ('S'), exit-long ('XL'), and exit-short ('XS') labels on the chart for quick identification 🏷️
Generates alerts based on crossover events between the typical price and best cost line 🔔
HOW TO USE
Add the indicator to your TradingView chart by selecting it from the indicators list.
Adjust the ATR Period and Factor parameters for the Supertrend component ⚙️.
Monitor the chart for plotted lines and labels indicating potential trade opportunities.
Set up alerts based on the generated signals to receive notifications when conditions are met 📲.
Use the filled areas between the body middle and trend lines for additional context.
LIMITATIONS
The indicator may generate false signals in highly volatile or ranging markets 🌪️.
Users should combine this indicator with other forms of analysis for more reliable trading decisions.
The effectiveness of the indicator may vary depending on the asset and timeframe being analyzed.
NOTES
Ensure that you have sufficient historical data available for accurate calculations.
Test the indicator thoroughly on demo accounts before applying it to live trading 🔍.
Customize the appearance and parameters as needed to fit your trading strategy.
Skrip sumber terbuka
Dalam semangat TradingView sebenar, pencipta skrip ini telah menjadikannya sumber terbuka, jadi pedagang boleh menilai dan mengesahkan kefungsiannya. Terima kasih kepada penulis! Walaupuan anda boleh menggunakan secara percuma, ingat bahawa penerbitan semula kod ini tertakluk kepada Peraturan Dalaman.
Avoid losing contact!Don't miss out! The first and most important thing to do is to join my Discord chat now! Click here to start your adventure: discord.com/invite/ZTGpQJq 防止失联,请立即行动,加入本猫聊天群: discord.com/invite/ZTGpQJq
Penafian
Maklumat dan penerbitan adalah tidak bertujuan, dan tidak membentuk, nasihat atau cadangan kewangan, pelaburan, dagangan atau jenis lain yang diberikan atau disahkan oleh TradingView. Baca lebih dalam Terma Penggunaan.