OPEN-SOURCE SCRIPT
Intraday Perpetual Premium & Z-Score
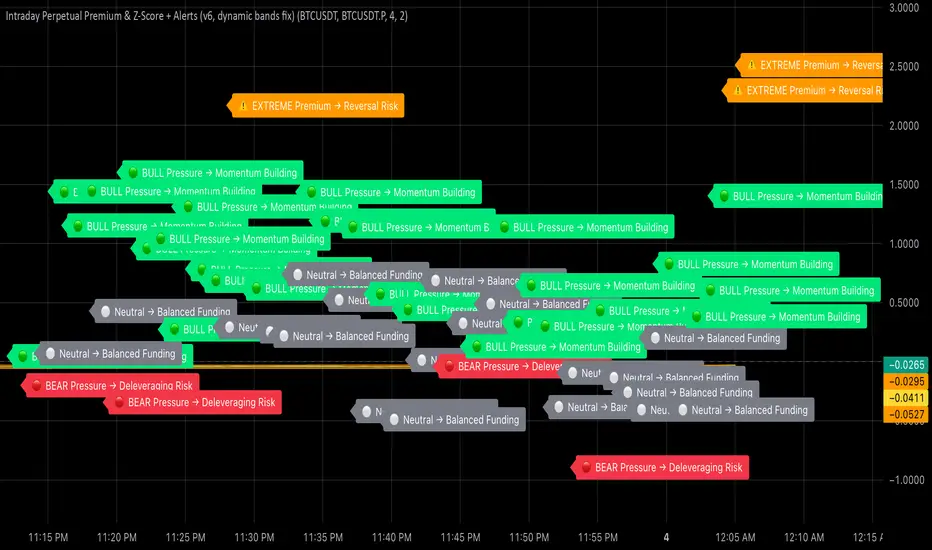
This indicator measures the real-time premium of a perpetual futures contract relative to its spot market and interprets it through a statistical lens.
It helps traders detect when funding pressure is building, when leverage is being unwound, and when crowding in the futures market may precede volatility.
How it works
• Premium (%) = (Perp – Spot) ÷ Spot × 100
The script fetches both spot and perpetual prices and calculates their percentage difference each minute.
• Rolling Mean & Z-Score
Over a 4-hour look-back, it computes the average premium and standard deviation to derive a Z-Score, showing how stretched current sentiment is.
• Dynamic ±2σ Bands highlight statistically extreme premiums or discounts.
• Rate of Change (ROC) over one hour gauges the short-term directional acceleration of funding flows.
Colour & Label Interpretation
Visual cue Meaning Trading Implication
🟢 Green bars + “BULL Pressure” Premium rising faster than mean Leverage inflows → momentum strengthening
🔴 Red bars + “BEAR Pressure” Premium shrinking Leverage unwind → pull-back or consolidation
⚠️ Orange “EXTREME Premium/Discount” Crowded trade → heightened reversal risk
⚪ Grey bars Neutral Balanced conditions
Alerts
• Bull Pressure Alert → funding & premium rising (momentum building)
• Bear Pressure Alert → premium falling (deleveraging)
• Extreme Premium Alert → crowded longs; potential top
• Extreme Discount Alert → capitulation; possible bottom
Use case
Combine this indicator with your Heikin-Ashi, RSI, and MACD confluence rules:
• Enter only when your oscillators are low → curling up and Bull Pressure triggers.
• Trim or exit when Bear Pressure or Extreme Premium appears.
• Watch for Extreme Discount during flushes as an early bottoming clue.
Skrip sumber terbuka
Dalam semangat TradingView sebenar, pencipta skrip ini telah menjadikannya sumber terbuka, jadi pedagang boleh menilai dan mengesahkan kefungsiannya. Terima kasih kepada penulis! Walaupuan anda boleh menggunakan secara percuma, ingat bahawa penerbitan semula kod ini tertakluk kepada Peraturan Dalaman.
Penafian
Maklumat dan penerbitan adalah tidak bertujuan, dan tidak membentuk, nasihat atau cadangan kewangan, pelaburan, dagangan atau jenis lain yang diberikan atau disahkan oleh TradingView. Baca lebih dalam Terma Penggunaan.