B1rd's Moving Average

With this indicator, we aim to provide you the best trend trading strategy that includes take profit and stop loss levels.
The fast moving average is named the base line, the slow moving channel is called the secondairy baseline.
Basic instructions:
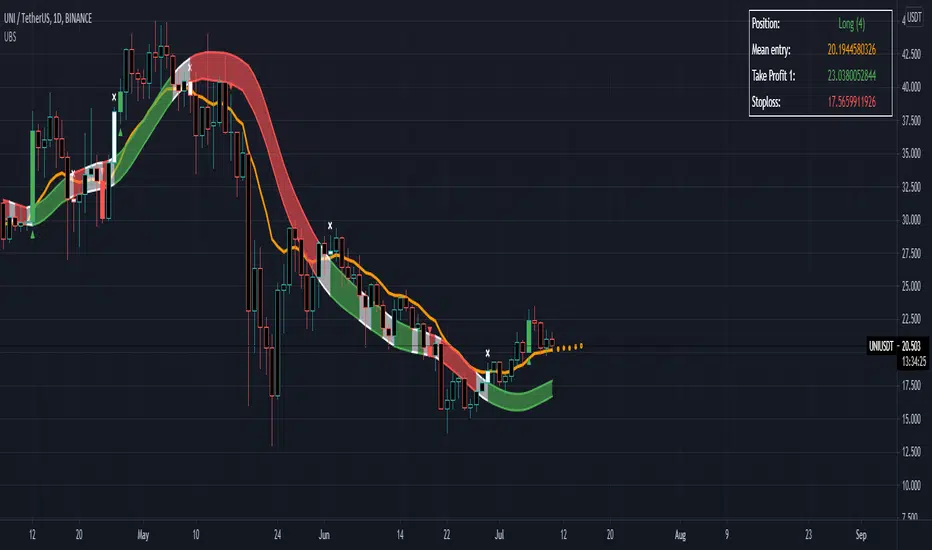
The strategy prints signals in the form of a green circle in the case of a LONG signal, a red circle in the case of a SHORT signal and white cross above the candle in the case of an exit signal.
Regarding Baselines
There are two Baselines, the primary orange baseline and the secondary which changes color. Both these trendlines are used to determine price trend.
The secondary Baseline consists of a Keltner Channel which is an average True Range of the secondary baseline moving average. The color red on the secondary baseline indicates a bearish trend and the green color indicates a bullish trend. A white secondary baseline indicates a NO TRADE ZONE
Regarding Signals
When price is above both baselines, a LONG signal may be printed by the strategy depending on further verification by other internal calculations.
The LONG signal indicates a bullish trend and allows you to open a long trade. The most optimal way to long the asset is when price is near or at the primary baseline. The qualifier zone also satisfies this criterion, especially when dealing with high momentum in price.
Trend continuation Signals are the color of the relative Trend and they have a diamond shape. They indicate continuation of the trend.
In the case of a SHORT signal, price must be below both baselines. A SHORT signal indicates a bearish trend and indicates opening a short trade. Regarding when to short the position, the same criteria for a long position apply. Namely when price is near or at the baseline or in the qualifier zone.
When an Exit Signal prints, a white cross above the candle for a Long and below the candle for a short, closing of the position in question is recommended.
Regarding stoploss, profit, closing of the trade
The plot tp/sl lines is used to indicate a hard stoploss and take profit level based on an average true range of price.
When a candle closes below both baselines after an active LONG signal or above both baselines after an active SHORT signal, closing the trade is recommended. These criteria serve as secondary exit indicators.
Settings:
The initial setting allows us to select a template from a list of already tested settings. We can change the Template with this setting, make sure to use the corresponding chart and timeframe to get accurate results. More template settings will be updated in the future. Choosing any template setting but custom will override any other setting within the indicator.
Second, we have settings that allow us to input the Smoothing Type and Length on both baselines.
This also manipulates the Keltner Channel surrounding the Secondairy Base Line.
Below this you can find the exit signal option, which will cause the indicator to print exit signals.
The next setting will call upon a forecast on the primary baseline, which could help you determine future support levels based on the selected moving average.
The show Qualifier line option will plot the Entry Qualifier. It will automatically determine trend based on close relative to the Base Line, however you can Override this with the boolean option.
Finally we can enable the Take Profit and Stop Loss options. By default, these will not plot. If you desire to see recommended Take Profit and Stop Loss Levels, you can enable the checkbox in this section.
Strategy
The primary function of this indicator is to detect changes in trend. But it can also be used to supply entry levels, take profit levels and stop loss levels.
Don't worry, the indicator still works exactly the same. But now you just have more inputs and options to work with.
For now it only works on the Daily Timeframe, it is automatically disabled on any other timeframe but the daily.
Skrip jemputan sahaja
Hanya pengguna disahkan oleh penulis boleh mengakses skrip ini. Anda perlu memohon dan mendapatkan kebenaran untuk menggunakannya. Keizinan selalunya diberikan selepas pembayaran. Untuk lebih butiran, ikuti arahan penulis di bawah atau hubungi dab1rd secara terus.
TradingView TIDAK menyarankan pembayaran atau penggunaan skrip kecuali anda mempercayai sepenuhnya penulis dan memahami bagaimana ia berfungsi. Anda juga boleh menjumpai alternatif sumber terbuka dan percuma yang lain di dalam skrip komuniti kami.
Arahan penulis
Penafian
Skrip jemputan sahaja
Hanya pengguna disahkan oleh penulis boleh mengakses skrip ini. Anda perlu memohon dan mendapatkan kebenaran untuk menggunakannya. Keizinan selalunya diberikan selepas pembayaran. Untuk lebih butiran, ikuti arahan penulis di bawah atau hubungi dab1rd secara terus.
TradingView TIDAK menyarankan pembayaran atau penggunaan skrip kecuali anda mempercayai sepenuhnya penulis dan memahami bagaimana ia berfungsi. Anda juga boleh menjumpai alternatif sumber terbuka dan percuma yang lain di dalam skrip komuniti kami.