OPEN-SOURCE SCRIPT
Diamonds Infiniti - Aynet Fibo
The "Diamonds Infiniti - Aynet Fibo" Pine Script combines the geometric visualization of diamond patterns with Fibonacci retracement levels to create an innovative technical indicator for analyzing market trends and potential reversal points. Below is a detailed explanation of the code and its functionality:
Key Features
Dynamic Fibonacci Levels
High and Low Points: The script calculates the highest high and lowest low over a user-defined lookback period (lookback) to establish a price range.
Fibonacci Price Levels: Using the defined price range, the script calculates the Fibonacci retracement levels (0%, 23.6%, 38.2%, 50%, 61.8%, 100%) relative to the low point.
Trend Change Detection
Crossovers and Crossunders: The script monitors whether the closing price crosses over or under the calculated Fibonacci levels. This detection is encapsulated in the isTrendChange function.
Trend Signal: If a trend change occurs at any of the Fibonacci levels (23.6%, 38.2%, 50%, 61.8%), the script flags it as a trend change and stores the bar index of the last signal.
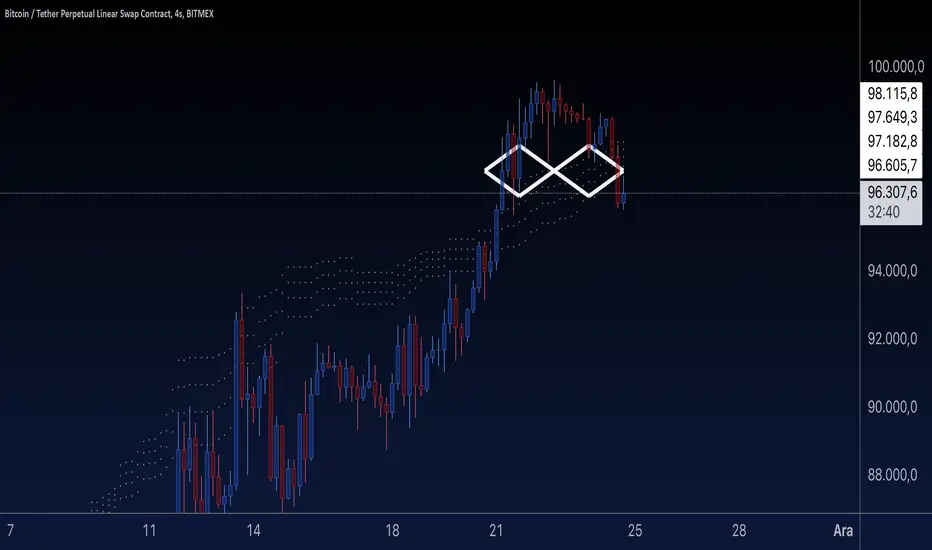
Diamond Pattern Visualization
Diamond Construction: The drawDiamond function draws a diamond shape at a given bar index using a central price, a top price, and a bottom price.
Trigger for Drawing Diamonds: When a trend change is detected, the script draws two diamonds—one on the left and one on the right—connected by a central line. The diamonds are based on the calculated price range (price_range) and a user-defined pattern height (patternHeight).
Fibonacci Level Visualization
Overlay of Fibonacci Levels: The script plots the calculated Fibonacci levels (23.6%, 38.2%, 50%, 61.8%) on the chart as dotted lines for easier visualization.
Scientific and Trading Use Cases
Trend Visualization:
The diamond pattern visually highlights trend changes around key Fibonacci retracement levels, providing traders with clear indicators of potential reversal zones.
Support and Resistance Zones:
Fibonacci retracement levels are widely recognized as key support and resistance zones. Overlaying these levels helps traders anticipate price behavior in these areas.
Adaptive Trading:
By dynamically recalculating Fibonacci levels and diamond patterns based on the most recent price range, the script adapts to changing market conditions.
Possible Enhancements
Multi-Timeframe Support:
Extend the script to calculate Fibonacci levels and diamond patterns across multiple timeframes for broader market analysis.
Alerts:
Add alerts for when the price crosses specific Fibonacci levels or when a new diamond pattern is drawn.
Additional Patterns:
Include other geometric patterns like triangles or rectangles for further trend analysis.
This script is a powerful visualization tool that combines Fibonacci retracement with unique diamond patterns. It simplifies complex price movements into easily interpretable signals, making it highly effective for both novice and experienced traders.
Key Features
Dynamic Fibonacci Levels
High and Low Points: The script calculates the highest high and lowest low over a user-defined lookback period (lookback) to establish a price range.
Fibonacci Price Levels: Using the defined price range, the script calculates the Fibonacci retracement levels (0%, 23.6%, 38.2%, 50%, 61.8%, 100%) relative to the low point.
Trend Change Detection
Crossovers and Crossunders: The script monitors whether the closing price crosses over or under the calculated Fibonacci levels. This detection is encapsulated in the isTrendChange function.
Trend Signal: If a trend change occurs at any of the Fibonacci levels (23.6%, 38.2%, 50%, 61.8%), the script flags it as a trend change and stores the bar index of the last signal.
Diamond Pattern Visualization
Diamond Construction: The drawDiamond function draws a diamond shape at a given bar index using a central price, a top price, and a bottom price.
Trigger for Drawing Diamonds: When a trend change is detected, the script draws two diamonds—one on the left and one on the right—connected by a central line. The diamonds are based on the calculated price range (price_range) and a user-defined pattern height (patternHeight).
Fibonacci Level Visualization
Overlay of Fibonacci Levels: The script plots the calculated Fibonacci levels (23.6%, 38.2%, 50%, 61.8%) on the chart as dotted lines for easier visualization.
Scientific and Trading Use Cases
Trend Visualization:
The diamond pattern visually highlights trend changes around key Fibonacci retracement levels, providing traders with clear indicators of potential reversal zones.
Support and Resistance Zones:
Fibonacci retracement levels are widely recognized as key support and resistance zones. Overlaying these levels helps traders anticipate price behavior in these areas.
Adaptive Trading:
By dynamically recalculating Fibonacci levels and diamond patterns based on the most recent price range, the script adapts to changing market conditions.
Possible Enhancements
Multi-Timeframe Support:
Extend the script to calculate Fibonacci levels and diamond patterns across multiple timeframes for broader market analysis.
Alerts:
Add alerts for when the price crosses specific Fibonacci levels or when a new diamond pattern is drawn.
Additional Patterns:
Include other geometric patterns like triangles or rectangles for further trend analysis.
This script is a powerful visualization tool that combines Fibonacci retracement with unique diamond patterns. It simplifies complex price movements into easily interpretable signals, making it highly effective for both novice and experienced traders.
Skrip sumber terbuka
Dalam semangat TradingView sebenar, pencipta skrip ini telah menjadikannya sumber terbuka, jadi pedagang boleh menilai dan mengesahkan kefungsiannya. Terima kasih kepada penulis! Walaupuan anda boleh menggunakan secara percuma, ingat bahawa penerbitan semula kod ini tertakluk kepada Peraturan Dalaman.
Penafian
Maklumat dan penerbitan adalah tidak bertujuan, dan tidak membentuk, nasihat atau cadangan kewangan, pelaburan, dagangan atau jenis lain yang diberikan atau disahkan oleh TradingView. Baca lebih dalam Terma Penggunaan.