OPEN-SOURCE SCRIPT
Telah dikemas kini [blackcat] L3 Xerxes Channels
Level 3
Background
The stock price channel theory is a widely used and mature theory in western securities analysis. In the 1970s, American Xerxes first established this theory.
Function
In fact, it is contained by the short-term small channel and runs up and down in the long-term large channel. The basic trading strategy is that when the short-term small channel approaches the long-term large channel, it indicates a recent reversal of the trend. The trend reverses downwards as the upper edge approaches, capturing short-term selling points. The trend reverses upward as the lower edge approaches, capturing short-term buying points. Studying this method can successfully escape from the top and catch the bottom in every wave of the market and seek the maximum profit.
The long-term major channel reflects the long-term trend state of the stock, the trend has a certain inertia, and the extension time is long, reflecting the large cycle of the stock, which can grasp the overall trend of the stock, and is suitable for medium and long-term investment;
The short-term small channel reflects the short-term trend status of the stock, accommodates the ups and downs of the stock, effectively filters out the frequent vibrations in the stock trend, but retains the up and down fluctuations of the stock price in the large channel, reflecting the small cycle of the stock, suitable for medium short-term speculation;
The long-term large channel is upward, that is, the general trend is upward. At this time, when the short-term small channel touches or is close to the bottom of the long-term large channel, it indicates that the stock price is oversold and there is a possibility of a rebound. The short-term small channel has touched the top of the long-term large channel, indicating that the stock price has been overbought, and there will be a correction or consolidation in the form, and there is a trend of approaching the long-term large channel. It is more effective if the K-line trend and the short-term small channel trend also match well;
The long-term big channel goes up, and the short-term small channel touches the top of the long-term big channel. At this time, the stock is in the stage of strong elongation. It can be appropriate to wait and see. When it turns flat in the short-term or turns its head down, it is a good delivery point, but it will penetrate If the area is a risk area, you should pay close attention to the reversal signal and ship at any time;
The long-term large channel is downward, that is, the general trend is downward. At this time, the short-term small channel or the stock price peaks and the selling pressure increases, and there is a downward trend again. The bottoming pattern means that the buying pressure is increasing, and there is a requirement for slow decline adjustment or stop decline, and the price movement will tend to be close to the upper edge of the long-term large channel. Callbacks should be treated with caution, and buy only after confirming the reversal signal;
The long-term large channel is down, while the short-term small channel penetrates the bottom line of the long-term large channel downward. At this time, it is mostly a slump process, and there is a rebound requirement, but the decline process will continue. It is not appropriate to open a position immediately. There is an upward trend, and when the short-term small channel turns back up and crosses back, it is a better opportunity to open a position at a low level;
When the long-term large channel is flat horizontally for a long time, it is to consolidate the market, and the price fluctuates up and down along the channel. At this time, it is the stage of adjustment, opening and washing, indicating the emergence of the next round of market. Short-term speculators can sell on highs and buy on lows. If the short-term small channel strongly crosses the long-term large channel, and the long-term large channel turns upward, it indicates that a strong upward trend has begun. If the short-term small channel penetrates down the long-term large channel, and the long-term large channel turns downward, it indicates that the decline will continue.
In a large balanced market, buy when the stock price hits the lower rail of the large channel at the bottom of the swing, and sell when the stock price hits the upper rail of the large channel at the peak of the swing.
Remarks
Feedbacks are appreciated.
Nota Keluaran
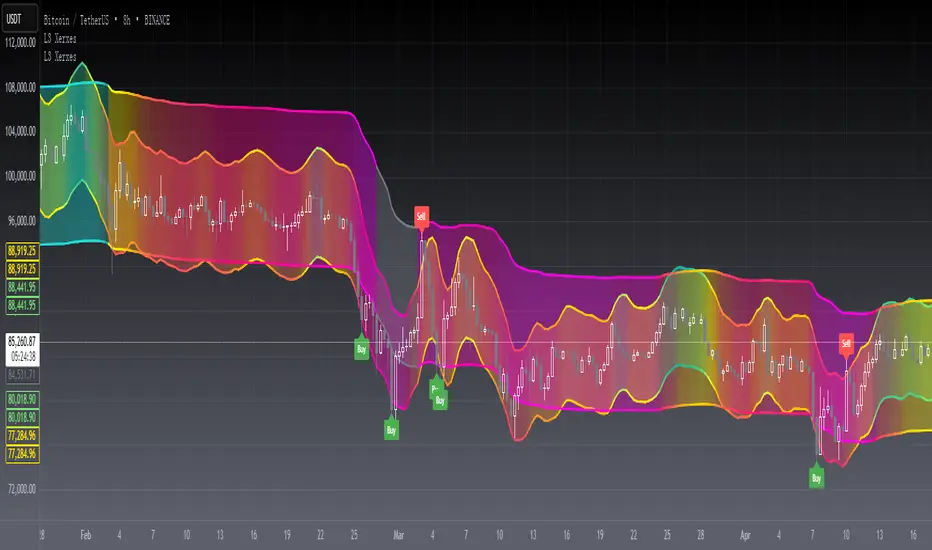
OVERVIEWThe [blackcat] L3 Xerxes Channels indicator is a sophisticated tool designed to help traders identify potential support and resistance levels using dynamic channel bands. By calculating exponential moving averages and applying custom smoothing factors, this indicator provides clear visual cues for buying and selling opportunities 📈💹.
FEATURES
Calculates Xerxes Channels based on customizable smoothing factors:
Smoothing Factor N: Controls the width of the inner bands.
Smoothing Factor M: Influences the dynamics of the outer bands.
Plots four distinct channel bands with gradient colors:
Upper Inner Band.
Lower Inner Band.
Upper Outer Band.
Lower Outer Band.
Displays buy ('Buy') and sell ('Sell') labels on the chart for quick identification 🏷️
Uses gradient colors to visually represent different RSI values within the channels
HOW TO USE
Add the indicator to your TradingView chart by selecting it from the indicators list.
Adjust the Smoothing Factor N and Smoothing Factor M parameters to fine-tune the sensitivity and appearance of the channels ⚙️.
Observe the plotted channel bands and labels to identify potential trade opportunities.
Use the buy and sell signals as part of your overall trading strategy.
LIMITATIONS
The indicator may generate false signals in highly volatile or ranging markets 🌪️.
Users should combine this indicator with other forms of analysis for more reliable trading decisions.
The effectiveness of the indicator may vary depending on the asset and timeframe being analyzed.
NOTES
Ensure that you have sufficient historical data available for accurate calculations.
Test the indicator thoroughly on demo accounts before applying it to live trading 🔍.
Customize the appearance and parameters as needed to fit your trading strategy.
Skrip sumber terbuka
Dalam semangat TradingView sebenar, pencipta skrip ini telah menjadikannya sumber terbuka, jadi pedagang boleh menilai dan mengesahkan kefungsiannya. Terima kasih kepada penulis! Walaupuan anda boleh menggunakan secara percuma, ingat bahawa penerbitan semula kod ini tertakluk kepada Peraturan Dalaman.
Avoid losing contact!Don't miss out! The first and most important thing to do is to join my Discord chat now! Click here to start your adventure: discord.com/invite/ZTGpQJq 防止失联,请立即行动,加入本猫聊天群: discord.com/invite/ZTGpQJq
Penafian
Maklumat dan penerbitan adalah tidak bertujuan, dan tidak membentuk, nasihat atau cadangan kewangan, pelaburan, dagangan atau jenis lain yang diberikan atau disahkan oleh TradingView. Baca lebih dalam Terma Penggunaan.