OPEN-SOURCE SCRIPT
Ehlers Early Onset Trend
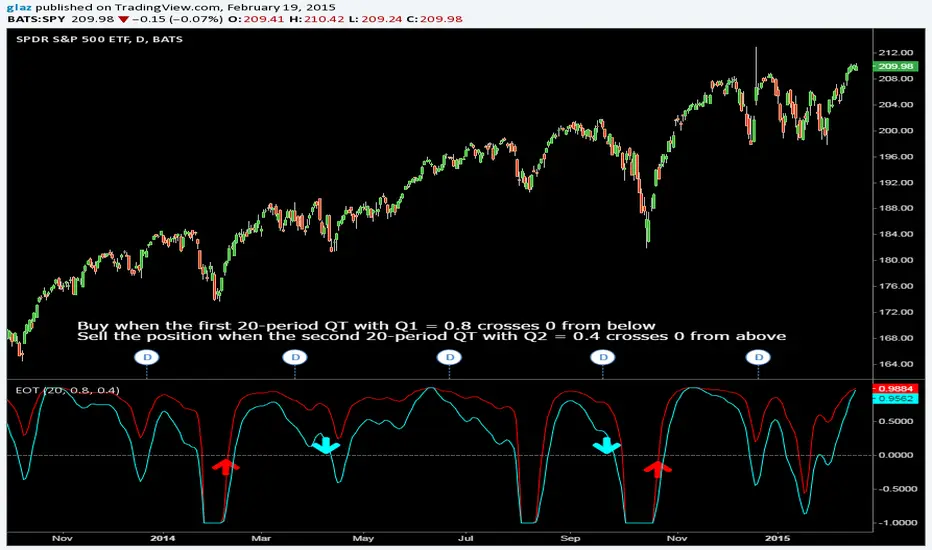
In his article in this issue, “The Quotient Transform,” author John Ehlers introduces the quotient transform (QT), a zero-lag filter that can be used for the purpose of timely trend detection. The QT is an advancement of the technique he presented in his January 2014 S&C article, “Predictive And Successful Indicators.” This time, the output of a roofing filter (which includes applying a high-pass filter and SuperSmoother filter) is normalized.
Code and other platforms traders.com/documentation/feedbk_docs/2014/08/TradersTips.html
Pinescript code Glaz and LazyBear
Code and other platforms traders.com/documentation/feedbk_docs/2014/08/TradersTips.html
Pinescript code Glaz and LazyBear
Skrip sumber terbuka
Dalam semangat TradingView sebenar, pencipta skrip ini telah menjadikannya sumber terbuka, jadi pedagang boleh menilai dan mengesahkan kefungsiannya. Terima kasih kepada penulis! Walaupuan anda boleh menggunakan secara percuma, ingat bahawa penerbitan semula kod ini tertakluk kepada Peraturan Dalaman.
Penafian
Maklumat dan penerbitan adalah tidak bertujuan, dan tidak membentuk, nasihat atau cadangan kewangan, pelaburan, dagangan atau jenis lain yang diberikan atau disahkan oleh TradingView. Baca lebih dalam Terma Penggunaan.