OPEN-SOURCE SCRIPT
Telah dikemas kini Supply/Demand Market Structure (SMA Multi-Timeframe)
Supply/Demand Based Market Structure
Structure + Order Blocks from Synthetic SMA Candles
Overview:
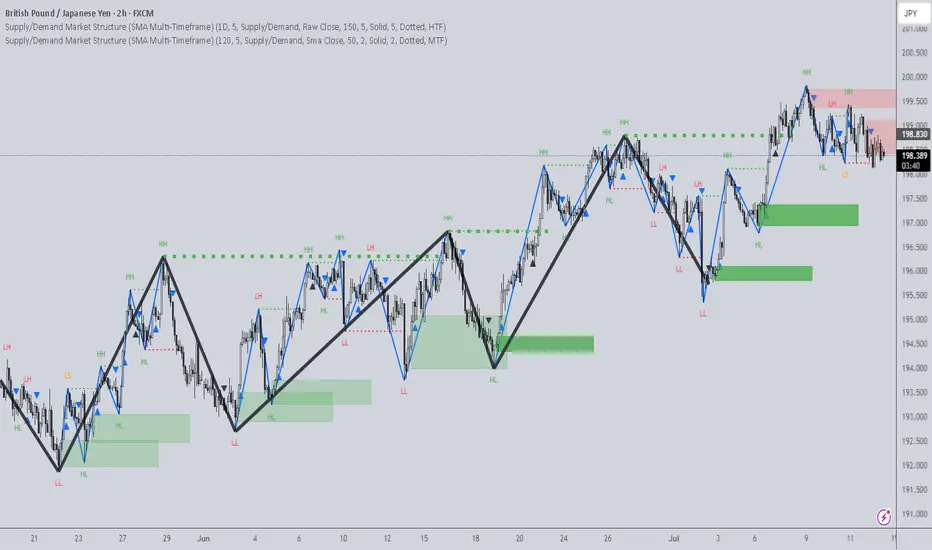
The SMA Supply/Demand Market Structure indicator combines market structure analysis with supply/demand logic, powered by SMA-based synthetic candles. Instead of relying on raw candle data, this tool generates smoothed higher-timeframe candles using simple moving averages to identify more stable zones and cleaner structure shifts.
It detects bullish and bearish breaks of structure (BoS), highlights swing points like HH, HL, LH, LL, and plots institutional-style supply and demand zones formed from aggressive rallies or drops. The result is a precise and noise-filtered view of market intent, perfect for trend-following or smart money strategies.
How It Works:
- Synthetic candles are created using SMA of OHLC values on your selected timeframe (HTF).
- A bullish break occurs when price closes above the high of the last bearish synthetic candle.
- A bearish break occurs when price closes below the low of the last bullish synthetic candle.
- Upon break confirmation:
- A demand zone is drawn using the last bearish candle.
- A supply zone is drawn using the last bullish candle.
- Each zone is extended forward for a user-defined number of bars and optionally deleted upon mitigation.
- Zigzag-based internal structure connects valid swing points and classifies them as HH, HL, LH, LL, including Liquidity Sweeps (LS).
- BoS levels are highlighted with lines that automatically reset when new structure forms.
Key Features:
- Synthetic SMA Candles: Smooth and reliable structure from average-based HTF candles
- Break Modes: Choose between raw HTF closes or SMA closes for break logic
- Custom Timeframe Selection: Analyze structure across any HTF you choose
- Dynamic Supply/Demand Zones: Auto-plot boxes from valid rallies/drops
- Mitigation Detection: Optionally fade or delete zones when price trades through
- Zigzag Structure Mapping: Automatically connect structural highs/lows
- BoS Detection: Real-time breakout of swing points with visual confirmation
- Smart Labels: Marks HH, HL, LH, LL, and LS directly on the chart
- Multi-timeframe Alert System: Notify for all structural changes, BoS, and new zones
How to Use:
- Set your desired HTF and SMA Length for synthetic candle smoothing.
- Use SMA=1 for raw candles
- Select a Break Mode:
- Raw Close: Uses standard HTF close values
- SMA Close: Uses smoothed closes from SMA
- Watch for bullish or bearish breaks — zones are plotted when price confirms breakout structure.
- Use demand zones as long entry areas and supply zones as short setups on retests.
- Rely on internal shifts and zigzag swings to monitor structure continuity.
- Enable alerts for swing formations, BoS, and liquidity sweeps to trade hands-free.
Recommended Strategies:
- Smart Money & ICT Models: Use synthetic demand/supply + BoS for mitigation or continuation plays
- Swing Trading: Align with higher timeframe structure and use zones for entry triggers
- Trend Trading: Confirm structure alignment and wait for pullbacks into zones
- Reversal Entries: Trade structure breaks when zones fail and a BoS confirms the shift
Customization Options:
- Timeframe input for custom HTF control
- SMA Length to adjust candle smoothing
- Zone Style: Control zone color, transparency, and duration
- Structure Display: Toggle swing labels and zigzag visuals
- Alert Mode: Choose between LTF, MTF, or HTF alerts
Summary:
SMA Supply/Demand Market Structure provides a clean, flexible view of price structure and institutional intent by fusing market structure with SMA-based synthetic candles. It’s ideal for anyone seeking reduced noise, visually guided entries, and rule-based trading based on structural shifts and real-time demand/supply dynamics.
Structure + Order Blocks from Synthetic SMA Candles
Overview:
The SMA Supply/Demand Market Structure indicator combines market structure analysis with supply/demand logic, powered by SMA-based synthetic candles. Instead of relying on raw candle data, this tool generates smoothed higher-timeframe candles using simple moving averages to identify more stable zones and cleaner structure shifts.
It detects bullish and bearish breaks of structure (BoS), highlights swing points like HH, HL, LH, LL, and plots institutional-style supply and demand zones formed from aggressive rallies or drops. The result is a precise and noise-filtered view of market intent, perfect for trend-following or smart money strategies.
How It Works:
- Synthetic candles are created using SMA of OHLC values on your selected timeframe (HTF).
- A bullish break occurs when price closes above the high of the last bearish synthetic candle.
- A bearish break occurs when price closes below the low of the last bullish synthetic candle.
- Upon break confirmation:
- A demand zone is drawn using the last bearish candle.
- A supply zone is drawn using the last bullish candle.
- Each zone is extended forward for a user-defined number of bars and optionally deleted upon mitigation.
- Zigzag-based internal structure connects valid swing points and classifies them as HH, HL, LH, LL, including Liquidity Sweeps (LS).
- BoS levels are highlighted with lines that automatically reset when new structure forms.
Key Features:
- Synthetic SMA Candles: Smooth and reliable structure from average-based HTF candles
- Break Modes: Choose between raw HTF closes or SMA closes for break logic
- Custom Timeframe Selection: Analyze structure across any HTF you choose
- Dynamic Supply/Demand Zones: Auto-plot boxes from valid rallies/drops
- Mitigation Detection: Optionally fade or delete zones when price trades through
- Zigzag Structure Mapping: Automatically connect structural highs/lows
- BoS Detection: Real-time breakout of swing points with visual confirmation
- Smart Labels: Marks HH, HL, LH, LL, and LS directly on the chart
- Multi-timeframe Alert System: Notify for all structural changes, BoS, and new zones
How to Use:
- Set your desired HTF and SMA Length for synthetic candle smoothing.
- Use SMA=1 for raw candles
- Select a Break Mode:
- Raw Close: Uses standard HTF close values
- SMA Close: Uses smoothed closes from SMA
- Watch for bullish or bearish breaks — zones are plotted when price confirms breakout structure.
- Use demand zones as long entry areas and supply zones as short setups on retests.
- Rely on internal shifts and zigzag swings to monitor structure continuity.
- Enable alerts for swing formations, BoS, and liquidity sweeps to trade hands-free.
Recommended Strategies:
- Smart Money & ICT Models: Use synthetic demand/supply + BoS for mitigation or continuation plays
- Swing Trading: Align with higher timeframe structure and use zones for entry triggers
- Trend Trading: Confirm structure alignment and wait for pullbacks into zones
- Reversal Entries: Trade structure breaks when zones fail and a BoS confirms the shift
Customization Options:
- Timeframe input for custom HTF control
- SMA Length to adjust candle smoothing
- Zone Style: Control zone color, transparency, and duration
- Structure Display: Toggle swing labels and zigzag visuals
- Alert Mode: Choose between LTF, MTF, or HTF alerts
Summary:
SMA Supply/Demand Market Structure provides a clean, flexible view of price structure and institutional intent by fusing market structure with SMA-based synthetic candles. It’s ideal for anyone seeking reduced noise, visually guided entries, and rule-based trading based on structural shifts and real-time demand/supply dynamics.
Nota Keluaran
Alert fix (BOS)Nota Keluaran
Zone accuracy improved. Added inputs. Default input adjustment.Nota Keluaran
"Invalidated Zones" mode bug fixSkrip sumber terbuka
Dalam semangat TradingView sebenar, pencipta skrip ini telah menjadikannya sumber terbuka, jadi pedagang boleh menilai dan mengesahkan kefungsiannya. Terima kasih kepada penulis! Walaupuan anda boleh menggunakan secara percuma, ingat bahawa penerbitan semula kod ini tertakluk kepada Peraturan Dalaman.
Penafian
Maklumat dan penerbitan adalah tidak bertujuan, dan tidak membentuk, nasihat atau cadangan kewangan, pelaburan, dagangan atau jenis lain yang diberikan atau disahkan oleh TradingView. Baca lebih dalam Terma Penggunaan.
Skrip sumber terbuka
Dalam semangat TradingView sebenar, pencipta skrip ini telah menjadikannya sumber terbuka, jadi pedagang boleh menilai dan mengesahkan kefungsiannya. Terima kasih kepada penulis! Walaupuan anda boleh menggunakan secara percuma, ingat bahawa penerbitan semula kod ini tertakluk kepada Peraturan Dalaman.
Penafian
Maklumat dan penerbitan adalah tidak bertujuan, dan tidak membentuk, nasihat atau cadangan kewangan, pelaburan, dagangan atau jenis lain yang diberikan atau disahkan oleh TradingView. Baca lebih dalam Terma Penggunaan.