OPEN-SOURCE SCRIPT
Volume Stress Level V2
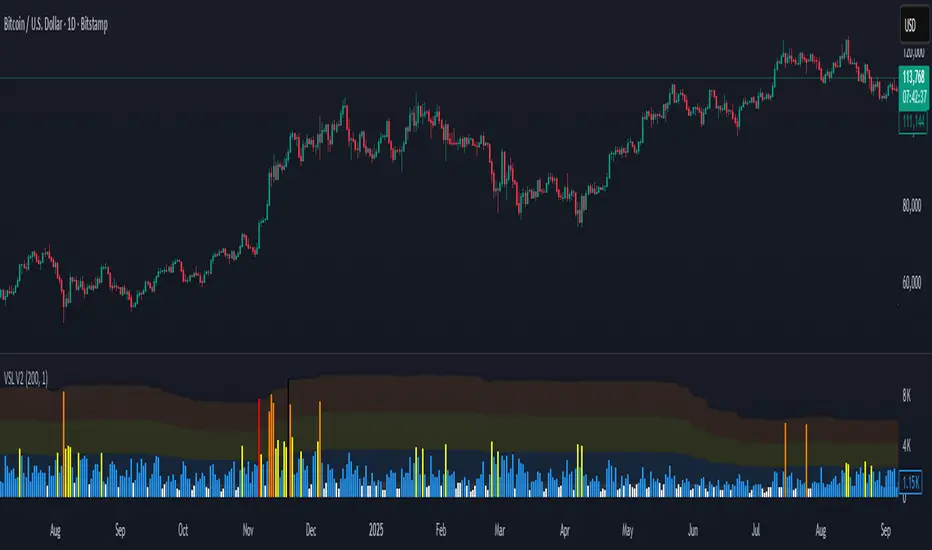
Volume Stress Level V2, is designed to provide a nuanced view of "RECENT" trading volume by identifying different levels of volume stress relative to a smoothed average.
Key Features:
Dynamic Volume Stress Calculation: The indicator calculates volume stress based on a Simple Moving Average (SMA) of volume and its standard deviation. The length of the SMA and the multiplier for the standard deviation are fully customizable, allowing you to adapt the indicator to different market conditions and trading styles.
Visual Volume Zones: The script visually categorizes volume into distinct zones:
Low Volume Zone: Represented by a white background, indicating periods of lower-than-average trading activity.
Normal Volume Zone: Highlighted in blue, signifying typical trading volume.
Medium Volume Zone: Displayed in yellow, denoting a moderate increase in volume.
High Volume Zone: Shown in orange, indicating significant volume spikes.
Spike Volume Zone: Marked in black, representing extreme volume events.
Customizable Background: You have the option to enable or disable the colored background fill for these volume zones, providing flexibility in how you visualize the data.
Bar Coloring: The volume bars themselves are color-coded according to the identified volume stress level, offering an immediate visual cue on your chart.
Adjustable Parameters:
VSL Length: Controls the lookback period for the SMA and standard deviation calculations.
Multiplier: Adjusts the sensitivity of the standard deviation bands, thereby influencing the width of the volume zones.
How to Use:
This indicator can be valuable for identifying potential shifts in market sentiment, confirming breakouts, or spotting periods of accumulation and distribution. By observing the transitions between volume zones, traders can gain insights into the conviction behind price movements.
Skrip sumber terbuka
Dalam semangat TradingView sebenar, pencipta skrip ini telah menjadikannya sumber terbuka, jadi pedagang boleh menilai dan mengesahkan kefungsiannya. Terima kasih kepada penulis! Walaupuan anda boleh menggunakan secara percuma, ingat bahawa penerbitan semula kod ini tertakluk kepada Peraturan Dalaman.
Penafian
Maklumat dan penerbitan adalah tidak bertujuan, dan tidak membentuk, nasihat atau cadangan kewangan, pelaburan, dagangan atau jenis lain yang diberikan atau disahkan oleh TradingView. Baca lebih dalam Terma Penggunaan.