Penunjuk

Anchored VWAP Engine [Quantum Algo]Anchored VWAP Engine
====================================================
🔶 OVERVIEW
Anchored VWAP Engine is a multi-stream anchored Volume Weighted Average Price indicator that removes the hardest part of trading with anchored VWAP: choosing the anchor. The engine runs up to seven independently anchored VWAP streams that place and reset their own anchors automatically — the week open (the default stream), session open, month open, confirmed swing highs and swing lows, the highest-volume bar in a lookback, and a liquidity-sweep anchor that re-anchors from the exact bar where a stop run occurred. On top of the streams it adds volume-weighted deviation bands, automatic confluence cluster zones where multiple streams converge, band-rejection signals, and a stability metric that names which VWAP the market is currently respecting most.
Out of the box the chart shows a single clean line: the week-anchored Volume Weighted Average Price with its deviation bands. Every additional stream is one checkbox away.
🔶 WHAT IS AN ANCHORED VWAP?
The Volume Weighted Average Price is the average price of an instrument weighted by traded volume — the closest public approximation of the average position price of everyone who transacted since a chosen starting point. An anchored VWAP starts that calculation from a meaningful event rather than an arbitrary date: a weekly open, a swing low, a high-volume climax bar. Price above an anchored VWAP means the average participant since that event is in profit; price returning to it often behaves as a decision level, because it is where the average position breaks even. The power of the tool depends entirely on where it is anchored — which is exactly what this engine automates.
🔶 WHY THIS SCRIPT IS ORIGINAL
1. Automatic multi-anchor engine. Seven streams anchor and re-anchor themselves from objectively defined events — no manual anchor placement, no stale anchors, no guessing.
2. The liquidity-sweep anchor. When a swing level is wicked through and rejected — a stop run — the sweep stream re-anchors from that exact bar and colors itself by implication: the accumulation tone after a sell-side sweep, the distribution tone after a buy-side raid. Averaging from the stop-run bar tracks the entry basis of the participants who engineered it. To our knowledge this anchor type has not been published before.
3. Exact swing anchoring. Swing-anchored streams rebuild their sums retroactively from the true pivot bar once the pivot confirms, so the calculation is mathematically identical to a VWAP hand-anchored on the swing itself — not started late at the confirmation bar.
4. Confluence clusters. When two or more active streams converge within an Average True Range tolerance, the engine draws a cluster zone and labels its strength. Multiple independent volume-weighted averages agreeing on one price is the strongest form of VWAP confluence, detected automatically.
5. The In Control metric. An exponentially decayed crossing-rate measures how cleanly price is respecting each stream; the dashboard names the stream currently in control. Users learn which anchor matters today instead of watching all of them equally.
6. True volume-weighted deviation bands. The bands are built from the volume-weighted variance of the primary stream — not a simple price standard deviation — at two configurable widths, with band-rejection signals printed as a single σ character whose full context lives in the hover tooltip, protected by a signal cooldown.
7. Quiet by default. One stream, one set of bands, capped signals, and a compact dashboard. The engine detects everything; the chart shows only what is asked of it.
🔶 HOW IT WORKS
Streams: Each stream maintains volume-weighted price and variance sums that reset on its anchor event — new week, new session, new month, a confirmed swing, a lookback volume record, or a qualified liquidity sweep. Between events the sums accumulate bar by bar, producing the stream's live anchored VWAP.
Sweep detection: A sweep qualifies when price wicks through the last confirmed swing level but closes back inside it, with per-level memory so the same level cannot re-trigger. The sweep stream then re-anchors from that bar.
Deviation bands: The primary stream (selectable; week open by default) carries inner and outer bands at configurable sigma multiples computed from its own volume-weighted variance, with softly tinted zones between them.
Signals: A wick beyond the outer band with a close back inside, on the correct side of the VWAP, prints the σ rejection signal — reversion bias toward the average — evaluated on closed bars only and rate-limited by the cooldown.
Clusters: On the live bar the engine groups all active stream values within the tolerance and draws a labeled zone for each group of two or more.
Dashboard: A fully themeable panel lists every stream with its live distance from price in Average True Range units and side, plus the In Control stream, active cluster count, and the current band width.
Non-repainting: Anchors use confirmed events, sweeps and signals are evaluated at bar close, and swing streams rebuild exactly rather than approximately.
🔶 HOW TO USE IT
1. Works on any market with reliable volume — cryptocurrency, stocks, indices, futures. On the default settings, read the week-anchored VWAP as the institutional benchmark: above it with rising distance means the average weekly participant is in profit.
2. Treat the VWAP itself as the decision level and the outer bands as stretch: σ rejections at the outer band carry a reversion bias back toward the average.
3. Enable the swing and sweep anchors to study reactions: price returning to a sweep-anchored VWAP is returning to the average entry of the stop-run — a level worth watching.
4. Cluster zones are the highest-value levels the engine produces: several independent volume-weighted averages agreeing on one price. Watch how price behaves on first touch.
5. Use the In Control row to pick which stream deserves your attention today, and the distance column to see what is nearby before it is hit.
6. Intraday traders can switch the primary stream to Session Open; swing traders can promote Month Open.
🔶 SETTINGS
- Anchors: independent toggles for all seven streams, swing pivot length, highest-volume lookback. Default: Week Open only.
- Primary stream selection with inner and outer band multiples.
- Cluster detection with Average True Range tolerance.
- Signals: toggle, cooldown, and signals to keep.
- Individual colors for every stream plus accent and neutral colors.
- Themeable dashboard: position, four text sizes, title band, background, frame, grid, and three text colors.
🔶 ALERTS
- Bullish / Bearish Band Rejection — price rejected the outer deviation band of the primary stream.
- Price Crossed Above / Below Primary VWAP.
- VWAP Cluster Formed — two or more streams converged into a confluence zone.
- Sweep Anchor Reset — a liquidity sweep occurred and the sweep stream re-anchored from the stop-run bar.
🔶 FREQUENTLY ASKED QUESTIONS
Does the indicator repaint? No. Anchor events are confirmed before they act, swing streams rebuild exactly from the confirmed pivot bar, and signals are evaluated on closed bars. Swing confirmation carries its standard pivot lag by design.
Why do I only see one line? By default only the week-anchored stream is enabled for a clean first chart. Every other anchor is a checkbox in settings.
What makes the sweep anchor special? It averages price and volume from the exact bar where stops were run — the basis of the participants who engineered the move — rather than from a calendar date or swing alone.
Why is there no cluster or In Control reading? Both features compare multiple streams; enable two or more anchors and they activate.
Which markets should avoid it? Any Volume Weighted Average Price tool is only as good as the volume feed. On symbols with unreliable or synthetic volume reporting, treat every stream with caution.
🔶 CREDITS
The Volume Weighted Average Price was introduced by Stephen Berkowitz, Dennis Logue and Eugene Noser (1988), and the anchored application was popularized by Brian Shannon, whose work established anchoring from meaningful events as a discipline. This script gratefully acknowledges both. The multi-stream auto-anchoring engine, the liquidity-sweep anchor, the exact retroactive swing rebuild, confluence clustering, the In Control stability metric, and all code in this script are original work — no third-party or open-source script code was reused.
🔶 LIMITATIONS
Volume quality determines VWAP quality; symbols with unreliable volume produce unreliable averages. Deviation bands need bars to mature after each re-anchor. Cluster detection reports convergence, not a guarantee of reaction. The In Control metric measures recent respect, not future behavior. No indicator replaces independent analysis.
🔶 DISCLAIMER
This script is provided strictly for educational and informational purposes. It is not financial advice, an investment recommendation, or a solicitation to buy or sell any financial instrument. Past behavior of any average, band, or cluster does not guarantee future results. Trading involves substantial risk. Always do your own research and manage risk independently. Penunjuk

VWAP Suite I EonMetricsVWAP Suite
VWAP Suite plots three independently anchored Volume-Weighted Average Price lines — Session, Weekly and Monthly — with volume-weighted deviation bands and the previous period's VWAP close kept on the chart as a reference level. Everything is computed from first principles at each anchor, so every line resets exactly where its period starts.
🔶 WHAT VWAP IS
VWAP is the average price of the period weighted by how much volume traded at each price. It answers one question: "what is the fair average price actually paid since the anchor?" That is why institutional execution desks benchmark fills against it, and why price so often reacts when it returns there — it is the level where the average participant in the period is at break-even. Above the VWAP the average buyer of the period is in profit; below it, under water.
🔶 WHAT IT DOES
Three anchors — Session (resets each trading day), Weekly and Monthly VWAP, each with its own toggle and color. Intraday traders typically work with Session, swing traders add Weekly, and Monthly serves as the higher-timeframe fair-value reference. Anchors that make no sense on the current chart timeframe (e.g. a Session VWAP on a daily chart) hide themselves automatically.
Deviation bands — ±1σ, ±2σ and optional ±3σ around ONE chosen anchor. The deviation is volume-weighted and anchored to the same period as the VWAP it wraps — not a rolling standard deviation — which is the statistically consistent way to band a VWAP (the same math TradingView's built-in VWAP bands use). ±2σ is the classic stretched-price reference; the optional gradient fill keeps the zones readable without clutter.
Previous VWAP Close — the exact level where the Session (or Weekly) VWAP finished its previous period, drawn flat through the current one. The same idea as previous day high/low, but volume-based: yesterday's fair price is a natural magnet and reaction level for today. Few VWAP tools carry this level forward — it is the reason this suite exists.
🔶 HOW IT IS CALCULATED
From each anchor the script accumulates three sums bar by bar: volume × price, volume, and volume × price². VWAP = Σ(volume × price) / Σ(volume). The band deviation comes from the volume-weighted variance Σ(volume × price²)/Σ(volume) − VWAP². At every period rollover the previous VWAP value is captured first, then the sums reset to zero. Values only update on confirmed data — there is no repainting logic anywhere in the script.
🔶 ALERTS
Seven alert conditions: price crossing each of the three VWAPs, price touching the +2σ or −2σ band, and price crossing the previous Session or previous Week VWAP close.
🔶 HOW TO USE
1. Pick your anchors — Session for intraday, add Weekly for swing context.
2. Choose which anchor carries the deviation bands (Bands Around).
3. Keep Previous Session VWAP on — reactions at yesterday's fair price are the cleanest thing this tool shows.
4. Set alerts on the crossings you actually trade around.
🔶 SETTINGS
Source (price input, hlc3 default) · Anchors (Session / Weekly / Monthly, each with color) · Deviation Bands (anchor selector, ±1σ/±2σ/±3σ toggles, gradient fill) · Previous VWAP Close (Session / Weekly levels).
🔶 HONEST LIMITATIONS
On CFDs and spot forex the data feed reports TICK volume (number of price updates), not true traded volume. VWAP built on tick volume is still the standard practice on those markets and tracks the real one closely on liquid symbols, but you should know what feeds the math. On symbols with no volume data at all the script deliberately shows nothing rather than fake a line. VWAP is a descriptive average, not a prediction — this tool draws levels, it does not generate signals.
Part of the EonMetrics toolset.
Penunjuk

Penunjuk

NIMBUS [ThrowMaster]NIMBUS — Ichimoku, Reimagined
Classic Ichimoku is brilliant at one question: "Where is the market right now — above, below, or inside equilibrium?" It is far weaker at a second question every trader actually asks: "What is the market about to do?" NIMBUS keeps the timeless Ichimoku framework intact and adds three dimensions built to close that gap — while staying, above all, honest about what it is: a context compass, not a signal service.
━━━━━━━━━━━━━━━━━━━━━━━━
WHAT NIMBUS ADDS
━━━━━━━━━━━━━━━━━━━━━━━━
⭐ Kumo Calendar — Twist Countdown
Here is a fact most traders overlook: the cloud in front of price is already fully drawn. It is built entirely from bars that have ALREADY closed, then shifted forward. That means the next Kumo twist — the moment Senkou Span A and B swap places — is knowable in advance. NIMBUS scans the forward cloud and counts the exact number of bars until that twist reaches price, and warns you when a thin (weak-support) section is approaching. Ichimoku's most-criticised trait, its lag, becomes a schedule you can read ahead of time.
🩵 Breath — Volume-Reactive Cloud
A traditional cloud shows only price geometry; two identical-looking clouds can hide wildly different conviction. NIMBUS makes the cloud breathe: it grows more solid on high-participation bars and fainter on quiet ones, using a rolling volume percentile. Strength becomes something you feel at a glance, not something you have to calculate. (If a symbol reports no volume, the cloud simply falls back to a fixed opacity — no errors, no false readings.)
🎯 Tenkan / Kijun Cross Clarity
The Tenkan–Kijun cross is one of Ichimoku's core events, yet on most charts it hides in a tangle of lines. NIMBUS marks it precisely: a teal circle at the exact price and bar of a bullish cross, coral for bearish. No hunting, no guessing.
◈ Alignment Hints
When four independent Ichimoku dimensions agree — price vs cloud, Tenkan vs Kijun, cloud colour, and the lagging read — AND price reclaims or loses the cloud on a confirmed bar, NIMBUS prints a small diamond. Think of it as a puzzle-game hint: a nudge to look at the right place at the right time. It is deliberately NOT a buy or sell command, and it never gives a target.
━━━━━━━━━━━━━━━━━━━━━━━━
HOW IT WORKS
━━━━━━━━━━━━━━━━━━━━━━━━
NIMBUS uses the standard Ichimoku engine — Tenkan (9), Kijun (26), Senkou Span A/B, and the lagging span, all fully adjustable. "Price vs cloud" always compares price to the cloud value formed 25 bars ago — the cloud actually sitting beneath price — so the reading reflects real, settled structure. The Breath layer reads a 100-bar volume percentile. The Twist Countdown walks the already-shifted forward cloud bar by bar. The dashboard summarises everything in one compact, theme-aware panel with a mobile Compact Mode.
━━━━━━━━━━━━━━━━━━━━━━━━
HOW TO USE
━━━━━━━━━━━━━━━━━━━━━━━━
• Read the cloud for trend context: above = bullish structure, below = bearish, inside = balance/chop.
• Watch the Twist Countdown to anticipate when the cloud's support/resistance character is about to flip — useful for planning, not for firing blind.
• Let Breath tell you whether a move carries participation or is running on fumes.
• Treat Hints as a reason to zoom in and do your own analysis, never as an instruction.
• Combine with your own risk management. NIMBUS describes context; your plan decides the trade.
━━━━━━━━━━━━━━━━━━━━━━━━
ON REPAINTING (honest)
━━━━━━━━━━━━━━━━━━━━━━━━
Once a bar closes, every Tenkan/Kijun/Span value is fixed and never redrawn. Hints and cross circles are all confirmed on bar close, so a printed mark cannot later disappear. The forward cloud is built only from closed bars, so it is fixed the moment it appears. Like all Ichimoku tools, values on the CURRENT, still-forming bar update in real time until that bar closes — this is inherent to the framework, not hidden repainting, and it is documented directly in the code comments.
━━━━━━━━━━━━━━━━━━━━━━━━
WHAT MAKES IT ORIGINAL
━━━━━━━━━━━━━━━━━━━━━━━━
NIMBUS is not another line pack bolted onto Ichimoku. The Kumo Calendar reframes the forward cloud as a countdown rather than a static shape; Breath encodes participation into the cloud's opacity; and the whole tool is presented as an explicit, self-aware CONTEXT instrument — it tells you what the market is, and refuses to pretend it knows your trade. The code is fully open for you to read, study, and learn from.
━━━━━━━━━━━━━━━━━━━━━━━━
NOTE
━━━━━━━━━━━━━━━━━━━━━━━━
No indicator predicts the future or guarantees results, and NIMBUS makes no such claim. It is a decision-support and context tool. Markets involve risk; always use independent judgement and sound risk management. Not financial advice.
Penunjuk

Penunjuk

SNIPERS CANDLES# Snipers Candles
Snipers Candles is a PVSRA-style candle indicator designed to help traders quickly identify notable volume activity directly on their charts.
The indicator changes candle colours based on the relationship between price movement and volume, making it easier to spot potential accumulation, distribution, momentum, and areas where market participation is increasing.
## Features
• PVSRA-style candle colouring
• Highlights increased volume activity
• Works on all markets and timeframes
• Clean and lightweight design
• Suitable for Forex, Indices, Commodities and Crypto
• Easy to combine with support/resistance, session analysis and market structure
## How I Use It
I use Snipers Candles as part of my overall trading framework alongside session highs and lows, liquidity levels, market structure, and price action confirmation.
The indicator is not intended to generate buy or sell signals on its own. Instead, it helps provide additional context by highlighting areas where volume may be influencing price movement.
## Disclaimer
This indicator is provided free of charge for educational purposes. It should not be considered financial advice. Always perform your own analysis and manage risk appropriately when trading financial markets.
Created by Market sniper HQ
Trade Like A Sniper Not Like The Crowd Penunjuk

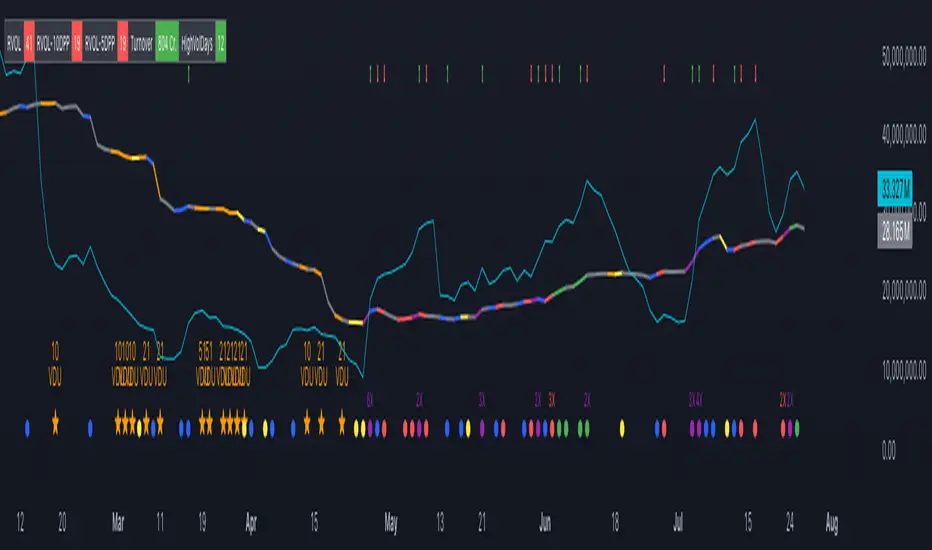
Orderflow Suite [martineye15]Orderflow Suite — four order-flow tools in one indicator: Cumulative Volume Delta, footprint bars, imbalance / absorption signals, and a volume profile. Each module toggles independently, so you can run the full suite or just the part you need. CVD gets its own pane; the footprint, signals and profile draw directly on the price chart, so no second script is required.
MODULES
- Cumulative Volume Delta (CVD): running buy-minus-sell volume, with Session / Day / Week / None reset anchoring and a Line, Columns or Candle display (candles show open = previous CVD, close = new CVD, wicks from the intrabar delta extremes). Optional price-CVD divergence: bearish when price makes a higher high while CVD makes a lower high, bullish when price makes a lower low while CVD makes a higher low.
- Footprint bars: the most recent bars are split into price bins, each showing aggregated buy x sell volume, shaded by its net delta, with the bar's highest-volume bin (VPOC) framed.
- Imbalance & absorption: delta-imbalance triangles when |delta| / volume passes a threshold, stacked-imbalance zones when several same-direction imbalance bars line up, plus absorption labels (heavy volume in a tight range near a swing) and exhaustion labels (a new swing high on negative delta, or a new swing low on positive delta).
- Volume profile: a volume-at-price histogram over a lookback window with POC, value-area high / low and the 70% value area, in total-volume or delta-coloured mode.
DELTA ENGINE (please read)
TradingView does not provide a true bid/ask tick feed, so delta here is an approximation, not exchange order flow. Historical delta is estimated from lower-timeframe intrabars: an intrabar counts as buy volume when it closes above its open, sell volume when below, and is split evenly on an unchanged close. On the live bar you can optionally accumulate tick-based delta instead (uptick = buy, downtick = sell). Because TradingView does not store ticks, realtime values built this way can differ from what the same bar shows after a chart refresh. Treat every delta value as an estimate.
ALERTS
Ten conditions: CVD bullish / bearish divergence, bullish / bearish imbalance, stacked bullish / bearish imbalance, absorption at highs / lows, and exhaustion top / bottom.
HOW TO USE
Add it to a symbol that has volume (crypto, futures or stocks — spot forex usually has no real volume, and the tool will tell you so). Intraday timeframes from about 1 minute to 1 hour work best. Turn on the modules you want, set the delta engine (lower-timeframe auto / manual, and optional realtime tick mode), and adjust the per-module thresholds and sizes. Use CVD and its divergences for momentum and non-confirmation, the footprint and profile to see where volume actually traded, and the imbalance / absorption / exhaustion signals as context around swings. Set alerts on any of the ten conditions.
WHAT MAKES IT DIFFERENT
It combines CVD, footprint, imbalance / absorption and a volume profile in a single indicator, sharing one delta engine and drawing the price-chart modules through force_overlay from a lower pane — a combined order-flow view without stacking several scripts. Drawing counts are budgeted internally so the modules together stay within TradingView's object limits.
REPAINTING & LIMITATIONS
Confirmed-bar behaviour is stable: footprints are built on closed bars, CVD divergences use confirmed pivots (so they appear a few bars after the pivot — normal pivot lag, not repainting), and the profile is computed over completed bars. The delta approximation is the main caveat: the live bar's delta is an estimate, and if you enable realtime tick mode, the live values will not match the same bar's historical lower-timeframe values after a refresh — this is inherent to how TradingView exposes data and is noted in the input tooltips. One-second intrabars need a plan with seconds data; without it the tool uses a one-minute fallback, and very old bars beyond the intrabar budget fall back to whole-bar classification. A symbol with no volume cannot produce delta and will show a notice instead.
This is a visual, decision-support tool. It is not a strategy, it places no orders and reports no performance statistics, and it is not financial advice. Penunjuk

Adaptive Volume Confluence OscillatorWhat it is
One pane that fuses seven different reads of the bar into a single 0–100 confluence score, gates that score by a trend-vs-chop regime filter, confirms it against an auto-mapped higher timeframe, and — most importantly — forward-calibrates its own Buy/Sell signals against an unconditional base rate, so you can see whether the construction actually carries an edge on your instrument.
The seven votes: momentum sign · momentum vs its signal · money flow · trend structure (MA fan) · price location vs VWAP · trend slope · higher-timeframe bias.
The displayed wave is a volume-flow ribbon; the votes drive the score, the signals and the verdict. A plain-language verdict and a subtle pane tint make it readable at a glance (Simple view); a full analytic layer is available for advanced users (Pro view).
Why these are combined (mashup rationale)
A single oscillator whipsaws and a single signal over-fires. Combining helps only when the inputs key on different quantities and their agreement is checked. Each vote reads a different thing — momentum, momentum-vs-signal, volume flow, multi-MA structure, location vs a session mean, slope, and a higher-timeframe read — so the count that agrees carries more information than any one of them alone. A Kaufman Efficiency-Ratio regime gate suppresses conviction in chop, and a forward-calibration harness ties the whole construction back to realised forward outcomes.
An honest caveat, stated up front: the votes are not statistically independent. The oscillator itself embeds money flow, and vote 2 is derived from vote 1's series. Treat the score as a weight-of-evidence read, not as seven independent confirmations. The harness exists precisely so you can check whether the construction earns its keep on your instrument rather than taking the claim on faith.
How it works
Score — how many of the seven votes are bullish, scaled 0–100.
Regime — Kaufman Efficiency Ratio. Below the chop threshold, conviction dims, signals are withheld, and the verdict reads "WAIT – choppy".
HTF — the chart timeframe auto-maps to a confirming higher timeframe (~4–6×), requested with lookahead_off and offset by one bar while the live bar forms.
Signals — Buy/Sell fire only when the oscillator crosses its signal at a statistical OB/OS extreme and the score agrees and the regime isn't choppy and the visible wave isn't already at the opposite extreme.
Climax — a volume spike at an OB/OS extreme prints a Possible Bottom/Top exhaustion mark.
Divergence (Pro) — regular + hidden, from confirmed pivots on the momentum oscillator.
Calibration — each Buy/Sell is queued and resolved a fixed horizon later, then compared with the unconditional same-horizon base rate. The dashboard shows, per side: Hit %, Edge = Hit − Base, sample size, and a Wilson-gated star.
How to use it
Read the verdict and the score. Above the gate = bullish weight of evidence; below = bearish; in between, or in chop, the tool says WAIT — and it means it.
Treat Buy/Sell marks as context, not triggers. They already require the score, the regime and the wave to agree, but they remain a description of conditions — not a recommendation.
Read the Edge row before you weight any signal. If Buy/Sell Edge isn't clearly positive with an adequate sample and a star, this construction is not carrying an edge on this instrument — weight it down or ignore it. Do not tune the parameters until the Edge turns green: that is curve-fitting, and the harness is there to catch it, not to be defeated.
Combine with your own levels, structure and risk rules.
Universal across markets
Price / high / low are inputs, so the engine runs on any symbol or timeframe. The volume votes (money flow, climax, VWAP location) need real volume — prefer a futures contract or a stock. On a symbol with no volume the tool degrades gracefully: money flow is neutralised, the score falls back to the price-only votes, and the dashboard says "NO VOLUME", so you're never misled by a blank or a phantom reading.
Non-repainting
Votes read confirmed closes. The HTF series uses lookahead_off and is offset by one bar while the live bar forms. Divergences come from ta.pivot* and confirm a few bars after the pivot; once printed they don't move. The calibration harness logs and resolves only on confirmed bars, so its statistics never inflate intrabar. The live oscillator updates each bar, like any oscillator.
Concept credits
Super Smoother and Ultimate Smoother low-lag filters — John Ehlers. Chebyshev Type-I filter — classical DSP. Recursive (Kalman) smoothing — R. E. Kalman. Volume Zone Oscillator — Walid Khalil & David Steckler. Accumulation/Distribution money-flow multiplier — Marc Chaikin. Efficiency Ratio — Perry J. Kaufman. ATR — J. Welles Wilder. Wilson score interval — Edwin B. Wilson. VWAP, Hull MA and percentile rank — standard public methods.
Original implementation; not affiliated with, nor endorsed by, any third party. No third-party code is reused.
Honest limits
The score is context, not a guarantee, and the votes are correlated (see the caveat above). The Edge figures are in-sample, close-to-close, with overlapping forward windows and no costs — descriptive context, not a verified backtest. An Edge near zero, negative, or unstable across timeframes is the harness honestly telling you the signal has no reliable edge on that instrument. Nothing here predicts price.
Disclaimer
Research and educational tool only. Not financial advice and no guarantee of profitability or accuracy. Indicators describe past behaviour; they do not predict the future. Trading carries risk of loss. Test out-of-sample and make your own decisions. The author accepts no liability for any use of this script. Penunjuk

CVD Pressure Ledger - Cumulative Volume Delta FlowCVD Pressure Ledger - Cumulative Volume Delta Flow
CVD Pressure Ledger is a neutral volume-pressure research tool for studying how cumulative volume delta evolves, resets, normalizes, and interacts with price response.
It is designed for traders who want to observe the slope of supply/demand pressure, volume imbalance, price-flow agreement, and effort-versus-response context without turning those observations into automated trade signals.
This script is a context and visualization tool, not a trading system. It does not generate buy/sell signals. It does not provide entries, exits, targets, stops, position sizing, forecasts, win-rate claims, or performance claims.
What It Visualizes
The script displays a reset-aware cumulative volume delta framework with several optional visual layers:
- CVD line
- CVD candles
- Bar delta histogram
- Rescaled pressure score line
- Zero line and reset anchor tint
- Neutral pressure background
- Compact ledger table
- Data-quality notes for limited volume, fallback mode, live bars, and non-standard charts
The goal is to make volume-pressure context readable without overloading the chart.
Delta Engine
The script offers multiple calculation modes:
1. Auto intrabar
The script first attempts to use an intrabar CVD calculation when a valid lower timeframe is available. If it cannot use intrabar data safely, it falls back to a bar-based approximation.
2. Intrabar CVD
Uses TradingView's official TradingView/ta library requestVolumeDelta() function to request lower-timeframe volume delta information and build intrabar-aware CVD candles when the selected lower timeframe is valid.
3. Tick-rule approximation
Estimates positive or negative delta from the candle direction. This is a bar-based approximation and is not real bid/ask order flow.
4. CLV range-weighted approximation
Estimates delta from where the close sits within the candle range using a Close Location Value style calculation. This is also an approximation and is not real bid/ask order flow.
Auto lower timeframe mode avoids seconds/tick requests by default for stability. Manual lower timeframe mode remains available for users who want to research smaller timeframes when their data plan, feed, and symbol support them.
What Makes It Different
Many CVD tools focus mainly on a cumulative line, CVD candles, or a delta histogram.
CVD Pressure Ledger adds several context layers around the core CVD calculation:
- Reset-aware CVD state
- Pressure score normalized to a -100 to +100 scale
- CVD z-score and percentile context
- Delta share normalization
- Pressure persistence age
- New positive/negative CVD extremes within the reset period
- Price-flow agreement and mismatch context
- Effort-versus-response classification
- A compact ledger fingerprint that summarizes pressure, z-score bucket, response bucket, state age, and mismatch context
This makes the script more of a volume-pressure ledger than a simple cumulative delta plot.
Pressure Score
The pressure score is a normalized composite value from -100 to +100. It combines several configurable components:
- CVD slope
- Delta share
- CVD z-score
- Pressure persistence
Each component has a user-adjustable weight. The score is not a signal. It is a research value intended to summarize the current pressure context.
Pressure states are classified as Positive, Negative, or Neutral using a configurable threshold, neutral band, and optional hysteresis. Hysteresis helps reduce rapid state flipping around the threshold.
Price-Flow Agreement
The price-flow agreement layer compares price slope and CVD slope over a configurable lookback.
It classifies the context into neutral descriptive states such as:
- Price up / flow up
- Price down / flow down
- Price up / flow soft
- Price down / flow firm
- Mixed / flat
The script can also detect when price-flow mismatch starts or expands. These are contextual observations only, not trade signals.
Effort vs Response
The effort-versus-response layer compares volume-delta effort with normalized price movement.
It can classify contexts such as:
- High effort / muted response
- Flow and price aligned
- Price response leads flow
- Low activity
- Mixed response
This layer is intended to help users study whether large delta activity is accompanied by a proportional price response. It does not imply absorption, reversal, continuation, or a future outcome by itself.
Ledger Fingerprint
The ledger fingerprint is a compact text summary shown in the table.
Example format:
P0 Z1 Rm A5 M0
Meaning:
- P+, P-, P0: pressure polarity
- Z0, Z1, Z2: CVD z-score bucket
- Rh, Rm, Rl: response bucket
- A: pressure state age
- M0, Mx, Mn: mismatch context
This helps users quickly compare the current volume-pressure context across symbols, timeframes, and reset settings.
Inputs and Customization
The script includes grouped inputs for:
- Delta engine
- Reset / anchor mode
- Normalization
- Pressure score
- Price-flow agreement
- Effort vs response
- Display mode
- Colors
- Ledger table
- Alerts
- Safety / data warnings
Users can adjust calculation mode, lower timeframe, reset method, session settings, smoothing, lookbacks, thresholds, weights, display mode, table position, table size, colors, and alert availability.
Display Modes
The script includes several display presets:
- Clean: CVD line, zero line, and compact table
- Candle: CVD candles and delta histogram
- Research: CVD, pressure score, histogram, and table context
- Minimal: CVD line with minimal warnings
The visual design is intentionally restrained so the output remains readable on both dark and light chart themes.
Alerts
The script includes factual alert conditions, such as:
- Pressure state changed
- Positive pressure state started
- Negative pressure state started
- Pressure returned to neutral
- New positive CVD extreme
- New negative CVD extreme
- Price-flow mismatch started
- Price-flow mismatch expanded
- High effort / muted response context
- Reset period started
- Data fallback active
Alerts are descriptive context events only. They are not entry, exit, buy, sell, target, or stop signals.
Limitations
Delta calculations are approximations unless the selected data source and TradingView functions provide suitable lower-timeframe information.
Lower-timeframe and intrabar calculations depend on available historical data, symbol, exchange, feed, and account/data-plan limits.
FX, CFD, index, and synthetic symbols may use tick volume, broker-specific volume, or limited volume data. This can affect all volume-based calculations.
If a chart has no usable volume data, CVD may appear as a flat line because there is no volume input to accumulate. In that case, the table will show a volume limitation note. This is expected behavior, not a directional reading.
Non-standard chart types such as Heikin Ashi, Renko, Kagi, Point & Figure, Range, and other synthetic charts can affect price, volume, and derived calculations.
Realtime values can update until the bar closes. When Confirmed bars only is enabled, events and alerts are gated to confirmed bars, but visual values may still update on the live bar.
The default settings are research starting points, not optimized parameters.
What This Script Does Not Do
This script does not:
- Generate buy or sell signals
- Recommend trades
- Forecast price
- Provide entries or exits
- Provide targets or stops
- Provide position sizing
- Claim accuracy, profitability, or statistical reliability
- Reconstruct true bid/ask order flow
- Replace exchange-native order book or footprint data
Suggested Chart Setup
For publication screenshots and general use, a clean chart is recommended:
- Use one liquid symbol with visible volume
- Show the full symbol and timeframe
- Use only this script on the chart unless another script is necessary and explained
- Use Research mode when demonstrating the full context layers
- Use Clean mode when showing the CVD line and ledger table more simply
Japanese Notes / 日本語補足
CVD Pressure Ledger は、累積デルタを単純に表示するだけではなく、出来高デルタの偏り、累積状態、リセット、正規化、価格反応との噛み合いを整理して表示する研究用インジケーターです。
このスクリプトは売買シグナルではありません。エントリー、エグジット、利確、損切り、ポジションサイズ、将来予測、勝率、利益性を示すものではありません。
主な確認項目は次の通りです。
- CVDの累積方向
- Bar deltaの偏り
- Pressure score
- CVD z-score
- Price-flow agreement
- Effort vs response
- Pressure state age
- Ledger fingerprint
Tick-rule と CLV range-weighted は近似計算です。実際のbid/ask約定方向を完全に復元するものではありません。
FX、CFD、指数、合成銘柄では、出来高がティックボリューム、ブローカー依存の出来高、または制限された出来高である場合があります。そのため、出来高ベースの計算は銘柄やデータフィードによって解釈に注意が必要です。
出来高が取得できないチャートでは、累積する出来高入力がないため、CVDが横棒のように表示されることがあります。これはインジケーターの故障ではなく、利用可能な出来高データがないことによる自然な挙動です。
平均足、練行足、カギ足、ポイント&フィギュア、レンジ足などの非標準足では、価格や出来高の扱いが通常足と異なるため、計算結果の解釈に注意してください。
リアルタイムの未確定足では値が更新される可能性があります。Confirmed bars only を有効にしている場合、イベントとアラートは確定足基準になりますが、表示値はライブバー中に更新されることがあります。
初期設定は研究開始用の値であり、特定の銘柄、時間足、市場に最適化されたものではありません。 Penunjuk

Smart FVG by EonMetricsSMART FVG
What it does
A "Fair Value Gap" (FVG) is a small gap left behind in price when a move happens so fast that a whole price area gets skipped over — nobody actually traded there. It shows up as a gap between three candles in a row. These gaps often get "filled" later, meaning price comes back to trade through that skipped area before continuing on its way (or reversing). This indicator finds these gaps automatically and draws a box around each one.
It also tells you which gaps look more important: a gap is marked "STRONG" only when BOTH of these are true at the same time — the gap is unusually large (measured against recent average volatility) AND the candle that created it traded on unusually high volume. Both conditions have to be true together; a big gap on quiet volume, or high volume with only a small gap, does not count as Strong. This two-part check is stricter than simply flagging "any big gap," which is what most similar tools do.
How to actually use it (step by step)
Let gaps form naturally as price moves. Each one is drawn as a colored box — green/cyan-ish tones for bullish (demand) gaps, red/orange tones for bearish (supply) gaps.
Pay extra attention to boxes marked "STRONG" — these represent a real, forceful, high-conviction move, not just random noise.
When price comes back down (or up) into a gap box, that's a potential trade opportunity — buy near a bullish gap, sell near a bearish gap — especially reacting at the dotted 50% line drawn through the middle of the box.
Look at the small number in the corner of each box — it counts how many candles ago the gap formed. A small number (fresh gap) is generally considered more reliable than a large number (old, already-tested-many-times gap).
If you turn on the higher-timeframe overlay, you'll also see gaps from a bigger timeframe (marked "HTF") plotted directly on your current chart — these represent bigger, more significant levels than same-timeframe gaps.
Every setting explained
Visualization group
Bullish FVG / Bearish FVG — the fill color for ordinary gaps.
Strong Bullish FVG / Strong Bearish FVG — the fill color for gaps that pass the "Strong" test above.
Show 50% Line (EQ) — draws a line through the exact middle of every gap box; this is a common spot for price to react to.
EQ Line Color.
Width Mode — controls how far the box stretches to the right: "Dynamic" keeps growing the box to reach today's candle in real time, "Fixed" stops the box at a set number of candles wide, "Extended" stretches the box all the way to the right edge of your screen forever.
Fixed Width (bars) — how many candles wide the box is, only used when Width Mode is set to Fixed.
Min FVG Size (x ATR) — the smallest gap size the script will bother drawing, measured against recent average volatility. Raise this to ignore tiny, insignificant gaps; set to 0 to see every gap no matter how small.
Mitigation group (mitigation = "price has now traded back through the gap")
Delete Mitigated Zones — when turned on, a gap box disappears completely once price fills it. When off, it stops growing and stays on the chart as a faded historical marker.
Mitigation Level — decide what counts as "filled": either price reaching the halfway (50%) point of the gap, or price completely closing the entire gap.
Mitigation Confirmation — decide what counts as reaching that level: any wick poking into it ("Wicks"), or a full candle close past it ("Close" — stricter, fewer false triggers).
Imbalance Age group
Show Age Label — displays a small number (like "34b") showing how many candles ago the gap was created.
Fade Old Zones — when turned on, gap boxes slowly become more transparent as they age, so your eye is naturally drawn to the freshest ones.
Max Age for Full Fade (bars) — how many candles it takes for a gap to reach maximum fade/transparency.
Strong Imbalance group
Mark Strong Imbalances — master on/off switch for the whole Strong-gap detection described above.
Min Gap Size (x ATR) — how big the gap must be (relative to recent volatility) to count toward "Strong" — this is one of the two required conditions.
Min Volume (x SMA 20) — how much higher than the recent 20-candle average volume the gap-forming candle's volume must be — this is the second required condition. Both this and the size condition must be true at the same time.
Show 'STRONG' Tag — shows the word "STRONG" written inside qualifying gap boxes.
Labels group
Show Labels — master switch for all text written inside gap boxes (age number, STRONG tag, HTF tag). Turn this off to hide all text and keep only the colored boxes.
Label Text Color.
MTF FVG group (MTF = "multiple timeframes")
Show Higher Timeframe FVGs — turns on the overlay of gaps from a bigger timeframe, drawn directly on your current chart.
Higher Timeframe — which bigger timeframe to pull gaps from (should be higher than whatever timeframe you're currently viewing).
HTF Bullish FVG / HTF Bearish FVG — colors for these imported higher-timeframe gaps.
Show HTF Label — shows an "HTF" tag inside these imported gaps so you can tell them apart from same-timeframe ones. Penunjuk

NSE/BSE Key Support & Resistance | MTF Pro-3.1Advanced pivot-based Support & Resistance with multi-timeframe confluence, strength scoring, volume-confirmed breaks, and adaptive zone visuals — built specifically for Indian stock market (NSE/BSE).
Overview
Most S&R indicators draw every pivot as an equal horizontal line and extend it infinitely to the right — creating cluttered, unreadable charts. This indicator solves that by scoring every level based on how strongly price rejected it , merging overlapping levels from different timeframes into a single confluence zone, and only showing the levels that actually matter.
Built and tuned specifically for NSE and BSE stocks, indices (Nifty 50, Bank Nifty, Sensex), and F&O instruments.
Key Features
🔷 Multi-Timeframe Support (4 TFs)
Enable up to 4 independent timeframes simultaneously. Each timeframe's pivots are detected separately and tagged in the label — , , , . You choose which timeframes to activate.
🔷 Cross-TF Confluence Merge
When two different timeframes produce a pivot at nearly the same price (within ATR proximity), they automatically merge into a single stronger zone instead of drawing two overlapping boxes. The label shows both sources — — and the level receives a confluence strength bonus. These merged zones are your highest-priority trade levels.
🔷 Advanced Strength Scoring
Every level carries a live strength score (★) that accumulates over time. Each touch is scored individually based on:
Wick size relative to candle range (how strongly price rejected)
Distance of close from the level (how convincingly price pulled back)
Whether volume was above average on that candle
Whether a strong body / engulfing candle formed
A barely touching wick scores ~0.5. A high-volume hammer rejection scores ~5–6. The score drives both zone opacity and zone width — strong levels appear bold and wide, weak levels fade visually.
🔷 Volume-Based Break Filter
A level is only invalidated when price closes beyond it and volume meets a configurable threshold (default: 1× average volume). Low-volume spikes through a level are ignored as false breakouts — the zone remains valid. Break alerts include the volume ratio so you know the conviction behind the move.
🔷 Adaptive Zone Visuals
No right extension — zones terminate at the current bar (valid) or the break bar (broken). No infinite lines cluttering the right side of your chart.
Opacity scales with strength — strongest levels are most visible, weakest levels are nearly transparent.
Zone width scales with strength — high-confidence zones are wider, giving a visual sense of the price area's importance.
🔷 Clean Labels
Each label shows the full picture at a glance:
21450.00 ★6.5 ×3
Timeframe source | Price | Strength score | Touch count
Settings Guide
SettingWhat it doesPivot LengthBars each side to confirm a pivot. Higher = fewer, stronger levelsMin StrengthHide levels below this score. Raise to show only confirmed levelsATR Merge DistanceHow close two levels must be to merge into oneInvalidationClose-based (reliable) or Wick-based (faster) break detectionVolume Break FilterRequire above-average volume to confirm a breakoutMin Volume MultiplierHow many times average volume needed to confirm a breakMax Active LevelsCap total zones shown on chartStrength → Zone OpacityToggle adaptive opacity based on strength score
How to Use
Bounce trades — price enters a green (support) zone → wait for a rejection candle with volume → enter above the rejection candle high, SL below zone bottom.
Rejection trades — price enters a red (resistance) zone → wait for a bearish candle with volume → enter below candle low, SL above zone top.
Breakout trades — price closes beyond a zone with high volume (break alert fires) → wait for pullback to the broken level → trade in the direction of the break.
Highest priority setups — zones tagged or with ★ score above 5 and multiple touches. These are the levels institutional money respects.
Alerts
The indicator fires alert() calls for:
Break confirmed — includes ticker, price, and volume ratio
Retest — includes ticker, price, and touch quality score
Set alert condition to "Any alert() function call" in TradingView's alert dialog.
Notes
Designed and tested on NSE/BSE equities and F&O stocks
Works on any timeframe from 1 minute to Weekly
All calculations are original — pivot detection, strength engine, confluence merge, and volume filter are built from scratch in Pine Script v6 Penunjuk

DAX Universe Relative Strength & Volume Quality [JS]DAX Universe RS & Volume Quality is a relative strength and pullback quality indicator designed for German stocks from the DAX, MDAX, SDAX and TecDAX universe.
The indicator measures a stock’s weighted relative performance against an equal-weighted German equity benchmark made from DAX, MDAX, SDAX and TecDAX. The relative strength model is inspired by IBD / Minervini-style momentum analysis, giving more weight to recent performance while still considering the medium- and longer-term trend.
Relative Strength Model:
• 40% weight: approx. 3-month performance
• 20% weight: approx. 6-month performance
• 20% weight: approx. 9-month performance
• 20% weight: approx. 12-month performance
The result is displayed as a percentage relative to the German stock universe benchmark:
• RS above 0% = the stock is outperforming the benchmark
• RS below 0% = the stock is underperforming the benchmark
• RS above the user-defined strength threshold = RS STARK / strong relative strength
In addition to relative strength, the indicator includes a High-Volume Down-Day filter. This helps assess whether a pullback is still constructive or whether distribution pressure may be increasing. The user can define:
• Lookback period
• Minimum loss required for a down-day to count
• Volume moving average length
• High-volume factor
• Maximum allowed High-Volume Down-Days
The simplified status box highlights the current setup condition using color:
• Green = strong relative strength and acceptable volume quality
• Yellow = positive or improving relative strength, but not yet ideal
• Red = weak relative strength or too many High-Volume Down-Days
The textbox position, size, width and height can be adjusted in the indicator settings.
This indicator is designed as a decision-support and screening tool for relative strength, pullback quality and German stock leadership analysis. It is not an official IBD RS Rating and does not provide financial advice or automatic buy/sell recommendations. Always combine it with your own chart analysis, risk management and market context. Penunjuk

Penunjuk

Penunjuk

Projected Volume (Intraperiod Estimate)Projected Volume (Intraperiod Estimate)
════════════════════════════════════════
OVERVIEW
Projected Volume replaces the standard volume study with a live, forward-looking
estimate of where the current bar's volume is likely to finish. Volume is only
known with certainty once a bar closes, which makes it hard to judge in real time
whether the bar in progress is trading heavy or light. This indicator solves that
by drawing the volume already traded as a solid column and projecting the
remaining, not-yet-traded volume as a hollow cap on top — so the anticipated
final volume of the developing bar is visible at a glance. The projection is
rebuilt on every update of the live bar and adapts to your chart timeframe and to
the data your subscription can access.
WHAT IT PLOTS
• Directional volume columns on every bar — green when close ≥ open, red when
close < open (the standard volume read you already use).
• On the current, unfinished bar only:
– a solid column for the volume traded so far;
– a hollow outline extending from the top of the solid column up to the
projected final volume;
– an optional label with the projected total and the percent of the period
elapsed.
As the bar fills in, the solid portion grows and the hollow cap shrinks toward
zero. At the close, projected equals actual.
HOW THE PROJECTION WORKS
The indicator uses two methods and selects between them automatically based on
whether sub-bar (intrabar) data is available.
1) Intraperiod volume profile — primary method
For each of the last N completed bars, the script requests lower-timeframe
volume and measures how volume accumulates through the period: what fraction of
the period's total volume is typically complete by the end of each time-slice —
the classic "how much of the day's volume is usually done by the first hour, the
second hour…" shape. That cumulative curve is averaged across the lookback window
to form a typical accumulation profile.
For the developing bar the script determines how far through the period it has
progressed, reads the typical cumulative fraction f at that point, and estimates:
projected total = volume so far ÷ f
Because the profile captures the real intraperiod shape — the U-shaped session
volume common in equities, or the flatter distribution of 24/7 crypto — the
estimate reflects typical behavior rather than assuming volume arrives at a
constant rate.
2) Average-of-increment — base-resolution fallback
When the chart is already at the lowest interval your data plan provides (for
example a 1-minute chart on a plan without seconds data), there is no sub-bar to
sample and the profile method does not apply. In that case the script projects:
projected total = volume so far + (1 − elapsed) × average volume of last N bars
This equals a typical bar early in the period, tracks the realized volume as the
bar fills, always sits at or above the volume already traded, and converges to
the actual figure at the close. It requires no lower-timeframe data and cannot
error. Elapsed time is measured from the clock, so no sub-bar feed is needed.
Automatic method selection
The script detects whether a usable lower timeframe exists that your plan can
serve. If so, it uses the profile method — and floors sub-sampling at one minute,
so 5m / 15m / 1h charts still build a genuine profile from 1-minute intrabars. If
not, it uses the average-of-increment fallback. The active method is shown in the
on-chart label, where a "· avg" suffix denotes fallback mode.
SETTINGS
• Intraperiod slices (12 / 24 / 48) — number of time-slices used to model the
accumulation curve within each period. 24 is roughly hourly on a daily chart.
• Lookback periods — number of completed bars averaged for the profile and the
fallback average (default 30).
• Auto sub-period timeframe — when on, the script chooses the intrabar sampling
resolution automatically. Turn off to set it manually.
• Manual sub-period timeframe — used when Auto is off; must be lower than the
chart timeframe.
• Allow seconds sub-sampling — off by default. Enable only if your plan provides
seconds data; when off, the script never requests sub-minute data and therefore
cannot error on a 1-minute chart.
• Min % elapsed before projecting — suppresses unstable projections in the
opening moments of a new bar.
• Up / Down volume colors and a toggle for the projection label.
READING THE LABEL
The label reads, for example, "Proj 1.2M (35% elapsed)" — the projected final
volume and how far the current period has progressed. A "· avg" suffix indicates
the average-of-increment fallback is active because intrabar data is unavailable
at that resolution.
BEHAVIOR, NOTES & LIMITATIONS
• Real-time by design. The projection exists only on the current, unfinished bar
and recalculates as that bar develops. Historical bars display actual traded
volume only — the indicator does not restate closed bars, but the live estimate
moves tick to tick as new volume arrives. This is expected behavior for a
forward projection, not hidden repainting.
• It is an estimate, not a guarantee. Accuracy is lowest in the first fraction of
a new bar and improves as the bar fills; the "Min % elapsed" input guards the
earliest, noisiest moments.
• The profile method depends on intrabar data availability, which varies by
symbol and subscription. Where it is unavailable, the indicator degrades
gracefully to the average-based method.
• Works across asset classes and timeframes. Because elapsed progress is measured
from intrabar count where available (and otherwise from the clock), it adapts to
both continuous (crypto) and session-based (equities/futures) markets.
• Volume reflects the data feed of the chart's symbol; index or aggregated tickers
may report volume differently from a single exchange.
CONCEPT
The tool pairs a standard directional volume histogram with an
intraperiod-accumulation model and presents the realized-versus-projected split
visually as a filled column plus a hollow cap. The aim is a single, glanceable
read on whether the bar in progress is on pace to finish heavy or light relative
to recent norms. Penunjuk

[ A L P H A X ] CATALYST - Volatility & Regime Prediction EngineAlphaX CATALYST — Volatility Ignition & Regime Prediction Engine: Compression Cycle Detection, Bias Vector Scoring, 6-Stage Regime State Machine & Ignition Probability Gate
AlphaX CATALYST is a professional-grade volatility prediction system built on a fundamentally different philosophy from every other indicator in the AlphaX suite. Where VOID, SURGE, FORTRESS, and ANCHOR all detect setups after price has established a structural context, CATALYST reads the market before the move happens. It does not wait for a breakout to confirm entry — it measures the energy compressing inside the market during quiet periods and predicts the ignition point before the explosion occurs. The core insight is simple but profound: markets breathe in cycles. They compress, coil, and then release energy in directional bursts. CATALYST quantifies every stage of that cycle — from the first signs of volatility contraction through full coil, ignition, trending expansion, and exhaustion — and fires signals only when the compression is deep enough, the directional bias during the coil is strong enough, and the higher timeframe structure confirms the direction. The result is a system that positions you at the moment of ignition — not a bar after the breakout has already occurred. Designed for volatility-aware traders across crypto, forex, gold, and indices on any timeframe.
━━━━━━━━━━━━━━━━━━━━━━━━━━━━━━━━━━━━━━━━
🌬 The Philosophy — Markets Breathe
Every major directional move in every liquid market is preceded by a period of compression. Price range contracts. Volume dries up. Volatility percentile falls toward historic lows. The Bollinger Bands compress inside the Keltner Channels. Narrow range bars form consecutively. This compression is not random — it is the mechanism by which institutional positions are accumulated quietly, without moving price, before the delivery move begins.
Most traders see this compression phase as boring or unreadable and look elsewhere for setups. CATALYST is built on the opposite premise: the compression phase is the most important and readable phase of the entire price cycle . The depth of the compression tells you how much energy is coiling. The directional bias during the compression tells you where that energy is most likely to be released. The higher timeframe alignment tells you whether that release is likely to be with or against the macro institutional flow.
By the time the breakout candle is obvious to everyone, CATALYST has already been tracking the setup for multiple bars — measuring compression depth, monitoring accumulation bias, and computing the ignition probability score in real time. When ignition fires, it fires with advance conviction — not reactive confirmation.
━━━━━━━━━━━━━━━━━━━━━━━━━━━━━━━━━━━━━━━━
⚙ The 6-Stage Regime State Machine
CATALYST is built around a deterministic 6-stage regime cycle that every market passes through on every timeframe. Understanding the regime is the foundation of using CATALYST correctly — the dashboard, background colors, and regime flip labels all communicate exactly which stage the market is in at every bar.
Stage 0 — QUIET
The market is dormant. No significant compression is building (score below 35). Volatility is neither low nor building toward a setup. This is the baseline state — the market is between cycles. Gray background tint. No actionable context.
Stage 1 — BUILDING
Compression is beginning to develop (score between 35 and 75). One or more compression signals are present — the squeeze may be turning on, narrow range bars may be forming, volume may be beginning to dry. The coil is winding up. Orange background tint intensifies slightly. The bias vector label appears on the current coil box to indicate which direction accumulation is occurring.
Stage 2 — COILED
Maximum compression state (score 75+, full BB/KC squeeze active). The spring is fully wound. Energy is at maximum concentration. This is the highest pre-ignition alert state. Deeper orange background tint. The coil box is rendered with higher opacity. The COILED flip label appears on the chart. Dashboard shows COMPRESS at 75%+ and SQUEEZE ON. This is the state you watch most closely — ignition can occur at any bar from here.
Stage 3 — IGNITION
A single-bar flash state. The regime transitions through IGNITION on the bar where all ignition conditions are simultaneously met — compression deep enough, bias directional enough, expansion candle large enough, ATR expanding. The cyan background tint and IGNITION flip label mark this bar. The IGNITE signal label fires on this bar. This is the entry bar. Immediately transitions to TRENDING on the next bar.
Stage 4 — TRENDING
The expansion phase. Price is in directional delivery. The regime holds TRENDING until one of the exhaustion conditions fires: RSI reaching extreme levels with climax volume, a significant wick rejection candle in the trend direction, a squeeze reforming during the trend (stall), or a reversal candle closing through the 21 EMA. Yellow-green tint during bull expansion, red tint during bear expansion.
Stage 5 — EXHAUSTION
The expansion energy is spent. One of the exhaustion conditions has triggered. Purple diamond markers appear above or below price. This is the early warning that the trend leg is ending — not necessarily the trend itself, but the current momentum leg. After EXHAUSTION, the regime resets: if compression begins building again, it cycles back to BUILDING; if not, it returns to QUIET and the cycle begins again.
Why the state machine matters: Every signal in CATALYST is regime-gated. Ignition signals can only fire from the COILED state. Exhaustion warnings can only fire from the TRENDING state. This ensures signals are always contextually appropriate — you cannot get an ignition signal without prior compression, and you cannot get an exhaustion warning without a prior trend.
━━━━━━━━━━━━━━━━━━━━━━━━━━━━━━━━━━━━━━━━
📉 The Compression Score Engine — Measuring the Coil
The compression score is a 0–100 composite reading that quantifies exactly how tightly the market is coiling at any given bar. It is the primary input to the regime state machine and is displayed live on the dashboard.
Six compression components and their weights:
Squeeze State (up to 30 points):
The BB/KC squeeze is the most powerful single compression signal. When Bollinger Bands are fully inside Keltner Channels, the market is at maximum volatility contraction — 30 points. If the squeeze fired on the previous bar (just released), 15 points are still awarded, capturing the residual compression energy at the moment of release.
Narrow Range Pattern — NR (up to 20 points):
The current bar's high-low range is measured against the lowest range over the lookback period (default: 7 bars). When the current bar has the narrowest range in the lookback window, 20 points are awarded. This is the NR7 pattern generalized to a configurable lookback — the classic volatility contraction signal.
NR Streak (up to 15 points):
Consecutive narrow range bars amplify the coil energy. When the NR count over the minimum coil duration reaches the threshold, 15 additional points are awarded. Multiple consecutive NR bars indicate the market has been compressing for a sustained period — a deeper, more energetic coil.
Volume Dry-Up (up to 15 points):
Current volume below the configurable fraction of its moving average (default: 65% of the 20-bar SMA) confirms institutional accumulation is occurring quietly — institutions are building positions without creating visible volume signals. 15 points awarded when volume is dry.
Volume Dry Streak (up to 10 points):
Multiple consecutive bars of volume dry-up, identical logic to the NR streak. Sustained low volume over multiple bars is a stronger coil signal than a single dry bar.
ATR Percentile Rank (up to 10 points):
The current ATR is ranked against its own history over the configurable lookback (default: 100 bars). When ATR is in the bottom 25th percentile of its historical range — meaning volatility is at a historic low for this instrument on this timeframe — 10 points are awarded. Below the 40th percentile scores 5 points. This ensures the compression is genuine historically, not just temporarily quiet in an already volatile market.
Reading the score:
0–35 — QUIET, no meaningful compression building
35–55 — BUILDING, compression developing but not yet actionable
55–74 — COILING, significant compression present
75–100 — FULLY COILED, maximum compression, squeeze active. Ignition-ready state
━━━━━━━━━━━━━━━━━━━━━━━━━━━━━━━━━━━━━━━━
🧭 The Bias Vector — Who Is Accumulating During the Coil?
Compression tells you the market is coiling. The Bias Vector tells you which direction institutions are accumulating during that coil. A range of -100 (fully bearish) to +100 (fully bullish), the bias vector is a composite of five independent directional pressure readings — each measuring accumulation from a different angle.
Volume Delta (up to ±25 points):
The estimated directional volume pressure — bull volume EMA minus bear volume EMA — forms the primary bias input. When delta is positive and rising (buyers accelerating), 25 points are added. When delta is positive but not accelerating, 10 points. The inverse applies for bear delta. This is the most direct measure of whether buyers or sellers are winning the quiet accumulation battle during compression.
Close-Position Bias (up to ±20 points):
Where closes fall within each bar's high-low range, averaged over the lookback period (default: 10 bars). When the average close position is in the upper 55%+ of the range — candles are consistently closing near their highs — buyers are controlling the candle closes. ±20 points based on whether the close bias is bullish (above 0.55) or bearish (below 0.45). This is a subtle but powerful measure of who is controlling the close during the coil.
Micro Structure (up to ±20 points):
Higher highs or higher lows over the structure lookback (default: 20 bars) vote bullish. Lower lows or lower highs vote bearish. ±20 points. Micro structure during compression tells you whether the coil is forming as a higher low (bullish coil) or a lower high (bearish coil) — the internal structure of the compression box reveals directional intent.
HTF Bias (up to ±20 points):
The higher timeframe EMA alignment (default: 60-minute, 50-period EMA). When HTF close is above the HTF EMA — the macro trend is bullish — +20 points. When below, -20 points. When Require HTF Alignment is disabled, this component is neutral. The HTF bias ensures the coil's directional reading is contextualized against the macro institutional flow.
Price vs BB Basis (up to ±15 points):
Whether the current close is above or below the BB basis (Bollinger Band midline). Price above the basis during compression means the coil is forming above fair value — a mild bullish signal. Price below the basis is mildly bearish. ±15 points. This adds a relative positioning dimension to the bias.
Reading the bias vector:
+35 to +100 — bull bias. Buyers are accumulating during the coil. Long ignition is favored
-35 to -100 — bear bias. Sellers are distributing during the coil. Short ignition is favored
-34 to +34 — neutral bias. No clear directional accumulation. Ignition may fire in either direction — lower conviction
Bias Arrow:
During BUILDING and COILED regime stages, a live bias arrow label appears below (bull bias) or above (bear bias) the coil box on the current bar, showing the directional score in real time. As new bars form, the arrow updates continuously — you can watch the bias building or shifting during the coil.
━━━━━━━━━━━━━━━━━━━━━━━━━━━━━━━━━━━━━━━━
🔥 The Ignition Score — 0 to 100 Probability Gate
Every bar in the COILED regime, CATALYST computes two separate ignition scores — one for long ignition, one for short. These scores gate whether a signal fires. Only when the score meets the configured minimum threshold (default: 62) does a signal become eligible.
Long ignition score components:
Compression depth (up to 20 points) — fully coiled scores 20, isCoiling scores 10, moderate compression scores 10
Squeeze state (up to 20 points) — squeeze release scores 20 (maximum — the spring just released), squeeze still active scores 10
Bias vector alignment (up to 25 points) — bias above +50 scores 25, above +35 scores 15, below 0 deducts 15
HTF alignment (up to 15 points) — HTF bullish scores 15, disabled scores 15 (neutral)
Expansion candle quality (up to 15 points) — strong bull body above ATR threshold scores 15, any bullish close scores 8
ATR expansion (up to 5 points) — ATR expanding above its short-term average confirms the coil is releasing
Volume delta confirmation (up to 10 points) — accelerating buy delta scores 10, positive delta scores 5
The short ignition score mirrors this structure with all conditions inverted.
What the score thresholds mean in practice:
90–100 — near-perfect setup. All components aligned. Extremely rare
75–89 — elite setup. Multiple high-weight components confirmed simultaneously
62–74 (default threshold) — high-quality setup. Sufficient confirmation to fire
50–61 — moderate quality. Available if you lower the threshold, but carries more false signals
Below 50 — low-quality ignition conditions. System will not fire at any reasonable threshold setting
The live long and short scores are displayed in real time on the dashboard as IGNITE L and IGNITE S — color-coded yellow-green or red when they meet the threshold, neutral otherwise. You can watch the ignition score building toward threshold in real time during the coil phase.
━━━━━━━━━━━━━━━━━━━━━━━━━━━━━━━━━━━━━━━━
⚡ The Ignition Signal — IGNITE Entry
The IGNITE label is CATALYST's primary entry signal. It fires when all of the following conditions are simultaneously confirmed on a bar close:
Hard requirements (all must be true):
Regime is in COILED state (compression score 75+, squeeze active)
The expansion candle body meets or exceeds the configured minimum (default: 1.15× ATR) — the breakout candle is large and directional
The bias vector is aligned with the signal direction (+35 or higher for long, -35 or lower for short)
ATR is actively expanding above its short-term average — the volatility expansion has begun
Squeeze has released on this bar or was releasing on the previous bar (when Require Squeeze Release is enabled)
Ignition score meets the minimum threshold (default: 62)
Session filter is satisfied (when enabled)
Signal cooldown has elapsed since the last signal
Signal label: A large IGNITE label appears below the bar (long) or above (short) on the exact ignition bar. Yellow-green for long, red for short.
Why this is fundamentally different from a standard breakout signal: A standard breakout indicator fires when price closes above a resistance level or a band. It reacts to what has already happened. CATALYST fires on the ignition bar only after verifying that the preceding compression was deep enough (COILED regime), that the directional bias during the coil was confirmed (bias vector), that the breakout candle itself is sufficiently large (body ATR check), and that the volatility is genuinely expanding (ATR expansion). Every component addresses a specific failure mode of basic breakout trading — false breakouts, weak breakouts, counter-HTF breakouts, and low-compression breakouts are all filtered before the signal fires.
━━━━━━━━━━━━━━━━━━━━━━━━━━━━━━━━━━━━━━━━
🔮 The Compression Coil Box
When the compression score crosses 55 and the BUILDING regime begins, CATALYST draws a live Coil Box — an orange-tinted rectangle spanning the high-low range of the entire compression period from the first coiling bar to the current bar.
What the coil box represents: The coil box is the visual representation of the spring being wound. Every bar that the coil remains active, the box extends to the right and expands to incorporate the new bar's range. The box's height represents the total price range of the compression period — the tighter this range, the more compressed the energy.
Box opacity: The box becomes more opaque when the compression reaches the fully COILED state (score 75+, squeeze active). This visual intensity progression gives you an immediate sense of compression depth — a faint box means early-stage building, a deep orange box means maximum coil.
Box on ignition: When ignition fires, the box remains on the chart at the coil range, giving you a clear visual reference for the compression zone that preceded the move. The coil box range is also used for structural stop loss placement — the SL Beyond Coil Box Edge setting places the stop loss beyond the coil box boundary rather than a fixed ATR distance from entry.
Box cleanup: When the regime returns to QUIET (compression fully dissipated without ignition), the box is deleted. When ignition occurs, the box is retained as a reference.
━━━━━━━━━━━━━━━━━━━━━━━━━━━━━━━━━━━━━━━━
⚠ Exhaustion Radar — Early Warning System
The Exhaustion Radar monitors the TRENDING regime for signs that the expansion energy is being spent. When exhaustion conditions are met, purple diamond markers appear above (bull trend exhaustion) or below (bear trend exhaustion) the bar — a warning that the current momentum leg is likely approaching its end.
Exhaustion conditions (any one is sufficient):
RSI climax with volume spike — RSI above the overbought threshold (default: 72) in a bull trend with volume exceeding the configured climax multiple (default: 2.2×). This combination of extreme RSI and high volume is the classic climax top pattern — buyers are exhausting their buying capacity simultaneously
RSI climax with volume spike (bear) — RSI below the oversold threshold (default: 28) with climax volume in a bear trend. Sellers exhausting
Wick rejection in trend direction — a bar with a rejection wick exceeding the configured minimum percentage (default: 55%) in the direction of the trend. A bull trend bar with a massive upper wick indicates aggressive selling into the highs — supply overwhelming demand at the extreme
Trend stall squeeze — when a squeeze (BB inside KC) forms during the trending phase while volume is also drying up. This indicates the expansion move has stalled into a new compression without resolution — energy is being absorbed rather than continuing
Reversal candle through 21 EMA — a strong opposing candle that closes through the 21-period EMA in the trend direction. In a bull trend, a strong bearish close through the 21 EMA indicates the trend's immediate momentum structure has been broken
How to use exhaustion signals: Exhaustion diamonds are not reversal signals. They indicate that the current momentum leg is likely complete — not that the trend has ended. Use them to take partial or full profit on trend trades, tighten trailing stops, or wait for the next CATALYST compression cycle to develop before re-entering.
━━━━━━━━━━━━━━━━━════════════════════════
🎯 Coil-Anchored Risk Guidance System
On every IGNITE signal, CATALYST draws forward-projecting risk guidance levels for the duration of the trade.
Stop Loss (SL):
When SL Beyond Coil Box Edge is enabled (default: on), the stop is placed beyond the coil box boundary — below the coil box low (long) or above the coil box high (short) — plus a small ATR buffer. The coil box represents the full compression range: if price returns into and through the opposite side of the coil box after ignition, the breakout has failed and the setup is invalidated. This gives the stop structural meaning beyond just an ATR distance. When the coil SL is less conservative than the fixed ATR SL, the system uses whichever is further from entry to ensure adequate protection.
TP1 — First Target:
2.0× ATR from the entry close (configurable). The initial partial profit target. At TP1, consider scaling out 50% of the position.
TP2 — Extended Target:
4.0× ATR from entry (configurable). The full expansion target for the remaining position — allowing the trailing stop or regime-based exit (exhaustion signal) to manage the remainder.
Level visualization: All three levels are drawn as horizontal dashed or dotted lines extending 12 bars forward from the signal bar, with price labels at the right edge showing exact levels. SL in red, TP1 in dim yellow-green, TP2 in bright yellow-green.
━━━━━━━━━━━━━━━━━━━━━━━━━━━━━━━━━━━━━━━━
📊 Live Dashboard
The 14-row real-time dashboard displays every internal state of the CATALYST engine on every bar.
REGIME — current stage: QUIET / BUILDING / COILED / IGNITION / TRENDING / EXHAUSTION. Color-coded by regime type
COMPRESS — live compression score 0–100%. Orange when above 50%, deeper orange when above 75%
SQUEEZE — ON (BB inside KC, maximum coil), RELEASE (squeeze just fired — highest-quality ignition condition), or OFF
ATR RANK — current ATR percentile versus its 100-bar history. Orange when below 30th percentile (historically low volatility — coil energy building)
VOL DRY — YES when current volume is below the dry-up threshold, NO otherwise. Orange when YES
BIAS VECTOR — the composite directional accumulation score with + or - sign. Yellow-green above +35, red below -35, neutral otherwise
HTF BIAS — higher timeframe EMA direction: BULL, BEAR, or FLAT
VOL DELTA — BUYERS when bull volume dominates, SELLERS when bear volume dominates
IGNITE L — live long ignition probability score 0–100. Highlights yellow-green when at or above the minimum threshold
IGNITE S — live short ignition probability score 0–100. Highlights red when at or above threshold
COIL BARS — number of bars the current coil has been active. Orange when at or above the minimum coil duration
COIL RANGE — the high-low range of the current coil box in price terms
SESSION — ACTIVE or FILTERED based on the session filter state
━━━━━━━━━━━━━━━━━━━━━━━━━━━━━━━━━━━━━━━━
📈 Chart Visual System
Compression Coil Box (orange) — live orange-tinted box spanning the full high-low range of the current compression period. Brightens on full coil. The core visual centerpiece of CATALYST
Regime Background Tints — subtle full-bar background colors for each regime: gray (QUIET), light orange (BUILDING), deeper orange (COILED), cyan (IGNITION), yellow-green or red (TRENDING), purple (EXHAUSTION)
IGNITE Label (below bar, yellow-green) — bull ignition signal. All conditions confirmed
IGNITE Label (above bar, red) — bear ignition signal
◆ Exhaustion Diamond (above bar, purple) — bull trend exhaustion warning
◆ Exhaustion Diamond (below bar, purple) — bear trend exhaustion warning
Bias Vector Arrow Label — appears near the coil box on the current bar during BUILDING and COILED phases, showing ▲ BIAS +xx or ▼ BIAS -xx in real time
Regime Flip Labels — small text labels marking every regime transition: BUILDING, COILED, IGNITION, TRENDING, EXHAUSTION. Color-coded by regime
SL Dashed Line (red) — stop loss guide extending 12 bars from ignition bar
TP1 Dotted Line (dim yellow-green) — first take-profit guide
TP2 Dotted Line (bright yellow-green) — extended take-profit guide
SL / TP1 / TP2 Price Labels — exact price levels labeled at the right end of each guide line
━━━━━━━━━━━━━━━━━━━━━━━━━━━━━━━━━━━━━━━━
🚀 How to Trade with AlphaX CATALYST — Step by Step
Step 1 — Monitor the Regime
Check the dashboard REGIME row. If it shows QUIET, nothing actionable is developing. If it shows BUILDING, a compression cycle is beginning — start paying attention
Watch COMPRESS build toward 75+. When SQUEEZE shows ON simultaneously, the market is in maximum coil state. This is your highest-alert pre-signal phase
Note the Coil Box forming and narrowing on the chart. The tighter the box, the more energy compressed inside
Step 2 — Assess the Bias During the Coil
Watch the Bias Arrow label near the coil box. Is it showing ▲ BIAS or ▼ BIAS? A strong positive bias (+50 or above) during a tight coil is the strongest possible pre-ignition setup
Check HTF BIAS on the dashboard — does it confirm the bias arrow direction? HTF alignment is worth 15 ignition score points and significantly increases the probability of a clean directional ignition
Watch VOL DELTA — are BUYERS or SELLERS winning the accumulation battle during the quiet phase?
If the Bias Vector is below ±35, the coil does not have strong directional conviction. Lower your size expectations or wait for bias to build
Step 3 — Watch the Ignition Scores Approach Threshold
As the coil deepens, watch IGNITE L and IGNITE S scores on the dashboard climbing toward the minimum threshold. When a score crosses the threshold and highlights, the system is primed — ignition can fire on the next qualifying expansion bar
The squeeze release (SQUEEZE shows RELEASE) is the most important single event in the ignition sequence. When the squeeze releases on a strong expansion candle in the bias direction, ignition fires immediately if the score is sufficient
Step 4 — Enter on the IGNITE Label
The IGNITE label marks the exact ignition bar. Enter on the close of the signal bar or the open of the following bar
The SL is placed beyond the coil box edge — below the coil low (long) or above the coil high (short). This is your structural invalidation: if price re-enters and closes through the opposite side of the coil box, the breakout has failed
TP1 at 2.0× ATR — scale out 50% here. Move the remainder to breakeven
Let TP2 or the first exhaustion diamond manage the remaining position
Step 5 — Exit on Exhaustion or Regime Shift
A purple diamond marks the exhaustion condition. Take profit on the remaining position or tighten the stop aggressively
The dashboard shows EXHAUSTION regime — the trend energy has been identified as spent
If no exhaustion fires and price continues, the system will track the regime as TRENDING — let the move run until exhaustion appears
After EXHAUSTION, the regime resets. Watch for a new compression cycle to build in the updated directional context
━━━━━━━━━━━━━━━━━━━━━━━━━━━━━━━━━━━━━━━━
⚠ Identifying Low-Quality Conditions — When Not to Trade
Stand aside when:
Regime is QUIET and COMPRESS is below 35 — no cycle is developing. CATALYST has nothing actionable and no signal can fire. Do not force entries
Regime reaches COILED but Bias Vector is below ±35 — the coil is real but the directional accumulation is inconclusive. Ignition in this environment carries reduced directional probability. Reduce size significantly or wait for bias to develop clarity
HTF BIAS opposes the bias vector direction — a bearish HTF while the bias vector is bullish means the coil is building against the macro institutional flow. Counter-HTF ignitions have a significantly lower success rate. Wait for HTF alignment
IGNITE L and IGNITE S scores are both below threshold — the market is compressing but neither a long nor short setup has sufficient confirmation quality. No signal will fire. Wait for the scores to build
Multiple regime cycles in rapid succession without trending — BUILDING → COILED → QUIET → BUILDING cycles that never reach IGNITION indicate a market in deep chop or accumulation. Do not try to anticipate the breakout direction — wait for the cycle to complete cleanly
Session shows FILTERED — the session filter has blocked the current time window. No signals will fire
COIL BARS is below the minimum coil duration — the compression has been too brief to build meaningful energy. A coil of 2 bars has far less stored energy than a coil of 8+ bars. Prioritize setups with longer coil durations
The ideal CATALYST setup:
COMPRESS at 80+, SQUEEZE ON for multiple bars
Bias Vector at +50 or above (long) or -50 or below (short)
HTF BIAS aligned with the bias direction
VOL DELTA confirming the bias direction (BUYERS for long, SELLERS for short)
IGNITE L or S score approaching 75+
COIL BARS at 5 or more — sustained compression
Squeeze RELEASE on the ignition bar — the spring snapping
Strong body expansion candle in the bias direction
When all these conditions align, CATALYST produces its highest-conviction ignition signals — setups where the compression depth, directional accumulation, HTF alignment, volume pressure, and expansion quality are all confirming simultaneously.
━━━━━━━━━━━━━━━━━━━━━━━━━━━━━━━━━━━━━━━━
⚡ Key Features
🌬 6-stage regime state machine — QUIET → BUILDING → COILED → IGNITION → TRENDING → EXHAUSTION. Every bar is classified and every signal is regime-gated
📉 Multi-component compression score — BB/KC squeeze, NR patterns, NR streaks, volume dry-up, volume dry streaks, and ATR percentile rank combined into a single 0–100 score
📦 Live compression coil box — orange-tinted box tracking the full range of the compression period in real time, brightening at maximum coil depth
🧭 5-component bias vector — Volume Delta, Close-Position Bias, Micro Structure, HTF EMA alignment, and BB Basis positioning combined into a -100 to +100 directional accumulation score
⚡ Live bias arrow label — directional score displayed near the coil box on the current bar, updating in real time during BUILDING and COILED phases
🔥 Dual ignition probability scores — separate 0–100 long and short scores computed every bar with a configurable minimum threshold gate
💥 IGNITE signal — fires only from COILED state on the exact bar where compression, bias, expansion candle, and ATR all confirm simultaneously
⚠ Exhaustion radar — RSI climax volume, rejection wick, trend stall squeeze, and reversal candle conditions produce early exhaustion warnings during the TRENDING phase
📡 HTF EMA bias filter — pulls higher timeframe directional structure into both the bias vector and the ignition scoring system
🎯 Coil-anchored SL placement — stop loss placed beyond the compression box structural boundary rather than a fixed ATR distance
🎨 Regime background tints — full-bar background colors for every regime stage, providing constant visual awareness of where the market is in the cycle
🏷 Regime flip labels — small text labels at every regime transition point on the chart history
📊 14-row live dashboard — Regime, Compress, Squeeze, ATR Rank, Vol Dry, Bias Vector, HTF Bias, Vol Delta, Ignition Scores, Coil Bars, Coil Range, Session updated every bar
🔔 5 alert conditions — Ignite Long, Ignite Short, Fully Coiled, Squeeze Release, Exhaustion Warning
⚙ Fully configurable — all ATR/BB/KC parameters, NR lookback, volume dry-up threshold, ATR percentile length, HTF timeframe and EMA, delta and structure lookbacks, ignition threshold, body size filter, exhaustion RSI/volume/wick parameters, SL/TP multiples, session windows, and all colors are independently adjustable
━━━━━━━━━━━━━━━━━━━━━━━━━━━━━━━━━━━━━━━━
⚙ Settings Reference
Volatility Engine
ATR Length — ATR calculation lookback used across the engine (default: 14)
BB Length / BB Mult — Bollinger Band parameters for squeeze detection (defaults: 20 / 2.0)
KC Length / KC Mult — Keltner Channel parameters (defaults: 20 / 1.5)
NR Pattern Lookback — bars for narrow range comparison. NR fires when current range is the narrowest in this window (default: 7)
Volume Dry-Up Length — lookback for volume moving average (default: 20)
Max Vol vs Avg (coil) — maximum volume as a fraction of average for the dry-up condition (default: 0.65)
ATR Percentile Lookback — history window for ATR percentile rank (default: 100)
Min Coil Duration (bars) — minimum consecutive bars needed for streak bonuses (default: 3)
Bias Vector
HTF Bias Timeframe — higher timeframe for EMA bias pull (default: 60-minute)
HTF EMA Length — EMA period on the higher timeframe (default: 50)
Require HTF Alignment — when on, HTF opposing direction deducts points from ignition scores
Volume Delta Length — EMA smoothing for volume delta estimation (default: 14)
Close-Position Bias Len — lookback for average close position within bar range (default: 10)
Structure Lookback — bars for micro higher high / lower low detection (default: 20)
Ignition Signals
Min Ignition Score (0–100) — threshold below which no signal fires (default: 62). 58–68 is practical range
Min Ignition Body (xATR) — expansion candle body must exceed this multiple of ATR (default: 1.15)
Require Squeeze Release — when on, ignition must occur on or after BB/KC squeeze releases
Show Ignition BUY/SELL Labels — toggle IGNITE signal labels
Show Exhaustion Warnings — toggle exhaustion diamond markers
Signal Cooldown (bars) — minimum bars between consecutive signals (default: 6)
Exhaustion Radar
RSI Overbought / Oversold — RSI thresholds for climax exhaustion detection (defaults: 72 / 28)
Climax Volume (x avg) — volume multiple above average required for RSI climax condition (default: 2.2)
Min Rejection Wick % — minimum wick as fraction of bar range for wick rejection exhaustion (default: 0.55)
Risk Guidance
Show SL / TP Guides on Signal — toggle level lines and labels
SL Distance (xATR) — ATR-based SL floor distance (default: 1.2)
TP1 Distance (xATR) — first take-profit target distance (default: 2.0)
TP2 Distance (xATR) — extended take-profit target distance (default: 4.0)
SL Beyond Coil Box Edge — places SL at the structural coil boundary rather than fixed ATR only (default: on)
Session Filter
Enable Session Filter — toggle the session restriction
London (08:00–13:00 UTC) — toggle London session inclusion
London/NY Overlap (13:00–17:00 UTC) — toggle the highest-volume overlap session
NY Afternoon (17:00–21:00 UTC) — toggle NY afternoon session
Display
Show Compression Coil Box — toggle the live orange coil box
Regime Background Tint — toggle the full-bar regime background colors
Show Bias Vector Arrow — toggle the live bias label near the coil box
Dashboard Position — Top Right / Top Left / Top Center / Bottom Right / Bottom Left / Bottom Center
Dashboard Size — Normal / Bigger
Theme
Bull Primary / Bright / Dim — yellow-green family for all bullish elements
Bear Primary / Bright / Dim — red family for all bearish elements
Coil / Squeeze — orange for all compression and coil elements
Ignition — cyan for the ignition regime flash
Exhaustion — purple for exhaustion regime and warning diamonds
Neutral — gray for QUIET regime and neutral states
━━━━━━━━━━━━━━━━━━━━━━━━━━━━━━━━━━━━━━━━
🔔 Alert Conditions (5 total)
Signal Alerts
CATALYST Ignite Long — all long ignition conditions confirmed. IGNITE label fired below bar
CATALYST Ignite Short — all short ignition conditions confirmed. IGNITE label fired above bar
State Alerts
CATALYST Fully Coiled — regime has entered COILED state (compression 75+, squeeze active). Ignition may be imminent — prepare
CATALYST Squeeze Release — BB has expanded outside KC on this bar. Maximum-quality ignition condition active
CATALYST Exhaustion — exhaustion conditions detected in the TRENDING regime. Trend energy fading
All alert messages are formatted as const strings for clean webhook and notification platform integration.
━━━━━━━━━━━━━━━━━━━━━━━━━━━━━━━━━━━━━━━━
🎯 Recommended Settings by Instrument & Timeframe
The default configuration is optimized for XAUUSD, major forex pairs, and crypto on M5–H1 :
Min Ignition Score at 62 — strong quality gate while allowing frequent enough signals on intraday timeframes
HTF at 60-minute — meaningful macro context for M5–M15 trading. The squeeze and ignition on M5 confirmed by H1 EMA alignment is the core multi-timeframe framework
ATR Percentile Lookback at 100 — calibrated for intraday volatility cycles on liquid instruments
NR Lookback at 7 — captures classic NR7 patterns while remaining sensitive enough for fast-moving instruments
For other instruments or timeframes, adjust:
M1–M3 scalping — reduce ATR Percentile Lookback to 50, reduce NR Lookback to 5, reduce Min Ignition Score to 58, shorten Cooldown to 3 bars
H1–H4 swing trading — set HTF to Daily or Weekly, increase ATR Percentile Lookback to 200–250, increase Min Ignition Score to 68–72, increase TP2 to 6.0–8.0× ATR for wider swing targets
Crypto (BTC, ETH) — increase KC Mult to 2.0–2.5 and BB Mult to 2.5 to account for wider natural volatility, increase Climax Volume threshold to 2.8–3.5 for crypto's naturally higher volume spikes
Higher signal frequency — lower Min Ignition Score to 55–58, reduce NR Lookback to 5, reduce Min Coil Duration to 2
Ultra-selective signals only — raise Min Ignition Score to 72–78, require Squeeze Release on, HTF Alignment on, increase Min Coil Duration to 5
━━━━━━━━━━━━━━━━━━━━━━━━━━━━━━━━━━━━━━━━
👥 Who This Is For
💥 Volatility breakout and expansion traders — CATALYST is purpose-built for traders who want to enter at the moment of volatility ignition, not after the move has already extended significantly
⚡ Squeeze traders and NR pattern traders — the compression engine formalizes and quantifies every squeeze and narrow range pattern into a single score, eliminating subjective judgment about whether a coil is "tight enough"
🔮 Anticipatory traders who want to read the market before it moves — the bias vector and ignition score system provides pre-signal intelligence during the coil that no reactive indicator can match
📊 Multi-timeframe traders — the HTF bias integration means every CATALYST signal is contextualized against the higher timeframe institutional flow
🧠 Systematic traders — every component of the compression score, bias vector, and ignition score is quantified and configurable. There is no subjectivity in what constitutes a "good enough" coil
🎯 Risk-conscious traders — the coil-anchored stop loss is structurally meaningful — placed at the exact level that invalidates the breakout thesis
📈 Traders across all asset classes — the ATR normalization and percentile-ranked volatility detection means CATALYST works consistently on gold, forex, crypto, and indices without manual recalibration between instruments
━━━━━━━━━━━━━━━━━━━━━━━━━━━━━━━━━━━━━━━━
📝 Notes
All signals are confirmed on bar close — the indicator is non-repainting by design. Regime state, compression score, bias vector, and ignition scores all finalize on confirmed bars
The regime state machine is sequential — IGNITION can only be reached from COILED. This means no signal can fire without prior confirmed compression regardless of how strong the expansion candle is
The ATR percentile rank requires the configured lookback history to be available. On charts with fewer bars than the ATR Percentile Lookback setting, the rank may underperform until sufficient history accumulates. This warm-up effect resolves naturally
The bias arrow label is drawn only on the last bar and refreshes on every tick during live trading. It does not appear on historical bars — only the current bar during BUILDING and COILED regimes
The SL / TP guide lines are redrawn on every new ignition signal. Previous signal levels are deleted when a new signal fires
Maximum 500 labels, 500 lines, and 100 boxes are rendered. The coil box, regime flip labels, and SL/TP levels all count toward these limits. On very active charts with long history, the oldest labels may be removed by TradingView's rendering limits
The session filter uses UTC hours rather than exchange-specific sessions, making it instrument-agnostic across all markets globally
The indicator does not track open positions or P&L — the regime state tracks the expansion direction (bull or bear) from ignition through exhaustion, but does not connect to any broker or account
━━━━━━━━━━━━━━━━━━━━━━━━━━━━━━━━━━━━━━━━
⚠ Disclaimer
This indicator is a technical analysis and visualization tool intended for educational and informational purposes only. It does not constitute financial advice or a recommendation to buy or sell any financial instrument. All signals are generated from historical and real-time price data using mathematical calculations — their accuracy or profitability is not guaranteed. Past performance of any signal type does not guarantee future results. Always conduct your own analysis, use proper risk management, and consult a licensed financial advisor before making any trading decisions. The author accepts no responsibility for any losses incurred from the use of this indicator.
━━━━━━━━━━━━━━━━━━━━━━━━━━━━━━━━━━━━━━━━
Built for traders who understand that the most powerful moment to enter a market is not when everyone can see the move — it is the bar before, when the coil finally snaps. Penunjuk

Whale Absorption Profile [JOAT]WHALE ABSORPTION PROFILE
The flagship orderflow visual in the JOAT suite. A complete institutional-grade footprint dashboard — heatmap candle strips, horizontal volume profile, delta ladder, side histogram, POC/VAH/VAL lines, and whale / absorption / imbalance glyphs — all driven by the same underlying lower-timeframe-reconstructed intrabar data and rendered in a curated asthetics. Built to give you the entire auction picture in one indicator, on chart, without a dedicated orderflow platform.
Six visual layers, one engine
Every layer reads from the same intrabar data pipeline. The pipeline uses request.security_lower_tf at a configurable LTF (1m / 3m / 5m / 15m / 30m) to sample sub-bar prints, classifies each via the standard tick rule, then buckets the classified volume into a price-binned profile (configurable rows, default 50). Every layer below reads from those bins.
Heatmap candle strips — the body of each recent chart candle is overlaid with horizontal heat slices coloured along an absorption-intensity ramp (deep blue → indigo → violet → magenta → gold). At a glance you can see where, inside each bar, the auction happened.
Horizontal volume profile — a classic side profile of total volume per bin, rendered with split buy/sell colour so you can read which side dominated each price.
Delta ladder column — a vertical ladder of per-bin delta (buy − sell), positionable to any of nine corners on the chart. Drawn as a horizontal-going-left-to-right cell array so it never collides with the dashboard.
Side volume histogram — a compact buy/sell volume histogram aligned to the profile bins, for traders who want a second view of side-share that is not contaminated by total volume.
POC / VAH / VAL lines — the Point of Control, Value Area High, and Value Area Low computed from the profile and rendered as horizontal lines that extend right of the latest bar.
Whale / Absorption / Imbalance glyphs — three separate detection layers (described below) each render a distinct on-chart glyph at the bin where their condition fires.
A Lite Mode toggle disables the heaviest layers (heatmap strips + side histogram) for low-end machines or multi-indicator stacking.
Three orthogonal detection layers
Whale Print — a bin qualifies as a whale row when total bin volume is above a configurable percentile (default 95th of the bin distribution) and is above the whale-delta threshold (default 70%). Both gates: large and one-sided.
Absorption Zone — score = min(buy, sell) / (priceMovement + ε) . High when both sides traded heavily but price did not move — the classic limit-order-absorption signature. A bin qualifies when its absorption score exceeds the configurable percentile (default 90th).
Imbalance Spike — a bin qualifies when one side's volume is at least N× the other (default 3.0×). The standard footprint imbalance ratio.
These three are deliberately separate — a single price can be a whale row, an absorption zone, and an imbalance spike at once, in which case all three glyphs fire and you have a textbook stacked-signature read.
POC shift alert
The Point of Control's bar-to-bar bin-distance is tracked. When the POC jumps more than the configurable POC Shift: Bin Distance Trigger (default 2 bins) between consecutive bars, the POC Shift alert fires — the auction's value has rotated price levels, which is the most actionable single regime-change signal a profile produces.
Visual aesthetic
A locked institutional palette: cyan-teal bull (#5CF0D7), magenta bear (#FF4D75), and a signature absorption ramp — deep void → ultramarine → indigo → violet → magenta → gold — designed to read like a heat-mapped orderbook on a deep-space background (#02011A). The four multi-stop gradients drive heatmap, absorption, delta, and whale layers independently, so the chart never looks visually flat.
Dashboard
Monospaced table, positionable to any of nine corners, with row-fade gradient. Surfaces:
Current POC price + bin distance from previous POC.
VAH / VAL price levels.
Cumulative bar delta.
Whale print count, absorption zone count, imbalance spike count in the lookback.
Current row classifications for the active price (Whale / Absorption / Imbalance).
LTF in use and bin count.
Alerts
Four alert conditions, each independently controllable:
Whale Print
Absorption Zone
Imbalance Spike
POC Shift (bin distance > threshold)
How to read it
Three reads, in order of conviction:
Stacked detection at the same bin — when a bin fires Whale + Absorption + Imbalance simultaneously, the auction has experienced a complete event: large size, both sides traded heavily, and the side imbalance was extreme. These are the rarest and strongest reads the script produces.
POC Shift through a previous structural level — value migration. The auction's centre of gravity has just moved through your S/R; the rest of the session usually follows.
Heatmap candle strip + delta ladder agreement — when the heatmap concentration sits at the same price the delta ladder shows one-sided imbalance, the bar is institutionally meaningful regardless of the candle shape.
Suggested settings
Defaults (1m LTF, 50 bins, 40-bar lookback, 95th percentile gates) are tuned for 5m–15m on liquid futures and crypto. For 1m scalping, drop bins to 30 and lookback to 20 to keep the script responsive. For 1H+ HTF, raise lookback to 100 and bins to 60. Lite Mode is recommended when stacking with other heavy indicators.
Originality
The implementation — the unified intrabar pipeline that feeds six independent visual layers, the percentile-gated whale detector, the min(buy,sell) / priceMovement absorption score, the diagonal-imbalance row detector, the multi-stop absorption gradient (six-stop signature ramp), the configurable delta ladder with nine-corner positioning, the POC bin-distance shift detector, and the grade composite palette — is JOAT-original. No third-party code reused. The footprint vocabulary (POC, VAH/VAL, imbalance, absorption, whale) is public-domain auction-theory language; this implementation is purpose-built for Pine v6 with bar data only.
Limitations
Reconstructed intrabar data is an approximation — the tick rule is the accepted public-market inference but it is not a direct read of bid/ask. Sub-minute LTFs require a TradingView Premium or Ultimate plan. The script renders many polylines, boxes, and labels — Pine's max_polylines_count / max_boxes_count / max_labels_count caps apply. Lite Mode exists specifically for low-spec / multi-indicator scenarios. POC, VAH, VAL, and detection layers are computed from confirmed intrabar data so they update on bar-by-bar close (non-repainting beyond the current developing bar).
—
-made with passion by jackofalltrades
Penunjuk

Flow Pressure OscillatorFlow Pressure Oscillator visualizes directional market pressure, trend alignment, regime quality, pullback pressure, and extended pressure conditions in a separate oscillator pane.
The tool is built to help traders read whether market pressure is leaning bullish, bearish, or neutral. It combines trend structure, EMA alignment, ATR-normalized movement, ADX, directional efficiency, volatility behavior, and volume participation into a bounded flow reading between -100 and +100.
The main Flow Trail shows the current pressure direction and strength. Positive readings indicate bullish pressure, negative readings indicate bearish pressure, and values near the zero line suggest a more neutral or mixed environment.
Regime Dots show the internal market regime state. Upper dots represent bullish regime pressure, lower dots represent bearish regime pressure, and neutral readings show that no strong directional regime is active.
The Pullback Reload Line is designed to highlight pullback pressure inside an existing bullish or bearish regime. It is not an entry signal by itself. It is meant to be used as context together with the Flow Trail, regime state, and the user’s own chart analysis.
The oscillator also highlights expansion and exhaustion-style pressure conditions. These areas can help identify when pressure is becoming stretched, accelerating, or losing momentum. They should be treated as market-context readings, not as guaranteed reversal or continuation points.
Core components
Flow Trail:
The main pressure line. It reacts to trend pressure, momentum slope, acceleration, structure alignment, volatility, and volume participation.
Zero Line:
A neutral reference level. Readings above zero show bullish pressure dominance. Readings below zero show bearish pressure dominance.
Regime Dots:
A visual regime filter for bullish, bearish, or neutral pressure conditions.
Pullback Reload Line:
A secondary pressure line designed to show pullback or reload behavior inside an active regime.
Pressure Fill:
A visual fill between the Flow Trail and the zero line to make pressure direction easier to read.
Extreme Pressure Coloring:
Highlights expanded, stretched, or exhaustion-style pressure states.
A simple way to use the oscillator is:
- Flow Trail above zero = bullish pressure is dominant;
- Flow Trail below zero = bearish pressure is dominant;
- Rising Flow Trail = pressure is strengthening;
- Falling Flow Trail = pressure is weakening;
- Regime Dots help confirm whether the broader pressure environment supports the current flow direction;
- Reload Line can help identify pullback pressure during an existing bullish or bearish regime;
- Extreme pressure areas should be used for awareness, not as automatic trade signals.
Important notes
Flow Pressure Oscillator is a market-pressure visualization tool only. It does not provide financial advice, trade recommendations, profit targets, stop losses, win-rate calculations, or performance guarantees.
The script should be used together with the trader’s own market structure, support and resistance, risk management, and confirmation process. No single oscillator should be used as a complete trading system. Penunjuk

Order Blocks with Volume [Quantum Algo]Order Blocks with Volume
OVERVIEW
This indicator finds order blocks — the candles where a directional move originated before price broke market structure — and measures the buy and sell volume that traded inside each one. Every zone is drawn as a box that extends forward until price returns to it, and each active zone is labelled with its total volume and its buy/sell split, so you can tell at a glance which blocks were built on heavy participation and which were not.
It is built entirely from price and volume on the chart you apply it to. There is no repainting of confirmed zones: detection runs only on closed bars.
HOW DETECTION WORKS
1. Market structure. Confirmed swing highs and swing lows are located using a pivot of configurable length (Swing Length). A larger value isolates more significant structure and produces fewer, larger zones.
2. Break of structure. When a candle closes above the most recent confirmed swing high (bullish) or below the most recent confirmed swing low (bearish), the indicator treats it as a break of structure and looks for the order block that produced the move.
3. The order block candle. Starting from the breakout, the script steps back over the impulse candles and marks the last opposite-close candle before the move began — the last down-close candle for a bullish block, the last up-close candle for a bearish block. This is the origin of the displacement and the level price often revisits.
4. Zone range. The block is drawn from that candle using either its full high-to-low range (Wick) or its open-to-close body (Body).
VOLUME ENGINE
For each order block candle the indicator estimates how much of the traded volume was buying versus selling, using where the candle closed within its own range:
- Buy volume is weighted by how close the candle closed to its high.
- Sell volume is weighted by how close it closed to its low.
This split is shown two ways:
- Buy / Sell volume bars: two horizontal bars anchored at the left of the zone — buy on the top half, sell on the bottom half — with lengths proportional to each side. The Volume Bar Length setting controls how long they can extend (they are automatically kept inside the zone).
- Volume label: written inside the zone on the right edge, showing the total volume of the block and the buy% / sell% balance.
Volume strength is the block's volume divided by the average volume over a configurable baseline (Volume Baseline Length). It is used by the optional filter below to keep only the heaviest blocks.
ZONE LIFECYCLE
- Active. A live zone extends to the current bar and shows its volume bars and label.
- Mitigation. When price first trades back into a zone, the 50% line marks the equilibrium and an alert can fire.
- Invalidation. A zone is invalidated when price moves through its far edge. The source can be a wick touch or a candle close (Invalidation Source).
- Breaker. If "Flip Broken Zones to Breaker Blocks" is on, an invalidated zone is kept and re-coloured as a breaker, since broken support can act as resistance and vice versa.
- Historic. If "Keep Invalidated Zones (Historic)" is on, finished zones are frozen at the bar they died, re-coloured neutral, and their volume bars and text are removed to keep the chart clean.
- If neither option is on, invalidated zones are removed.
To avoid clutter the indicator will not stack a new zone on top of an existing active zone in the same area, limits the number of active zones per side, and automatically drops any zone older than the drawing range.
ON-CHART ELEMENTS
- Coloured boxes: bullish and bearish order blocks (and a neutral colour for breaker/historic).
- Two inner bars per active zone: buy (top) and sell (bottom) volume.
- A dotted line through the middle of active zones: the 50% mitigation / equilibrium level.
- Text inside active zones: total volume and buy% / sell%.
SETTINGS
Structure & Detection
- Swing Length — pivot length used to define structure. Higher = larger, more significant zones.
- Impulse Lookback (bars) — how far back to search for the origin candle after a break of structure.
- Zone Range — Wick (full range) or Body (open-to-close).
- Max Active Zones / Side — cap on simultaneously active zones per direction.
Invalidation
- Invalidation Source — Wick (a high/low piercing the zone) or Close (a candle closing beyond it).
- Flip Broken Zones to Breaker Blocks — keep and re-colour broken zones as breakers.
- Keep Invalidated Zones (Historic) — freeze finished zones instead of deleting them.
Volume Engine
- Show Volume Label — write volume and buy/sell% inside active zones.
- Show Buy / Sell Volume Bars — draw the proportional buy/sell bars.
- Volume Baseline Length — averaging length used to rate volume strength.
- Volume Bar Length (bars) — maximum length of the buy/sell bars.
Filters
- Only Show High-Volume Zones — hide blocks below the strength threshold.
- Min Volume Strength (x avg) — threshold as a multiple of average volume.
- Filter Oversized Zones — skip blocks taller than the ATR limit.
- Max Zone Height (ATR x) — the height limit, in multiples of ATR.
Style
- Bullish Zone, Bearish Zone, Buy Volume, Sell Volume, Breaker / Historic, Text — colours.
- Zone Extension (bars) — how far active zones project past the current bar.
- Show 50% Mitigation Line — toggle the equilibrium line.
ALERTS
Alerts are raised through the alert() function for two events: an order block being tapped (mitigation) and an order block being broken (breaker formed). To use them, create an alert on the indicator and choose the "Any alert() function call" condition.
HOW TO USE
Order blocks mark areas where significant orders were likely placed. Traders commonly watch for price to return to an un-mitigated block and react there, and use the buy/sell volume split and strength to judge how meaningful a block is — a block built on high, one-sided volume is generally treated as more significant than a thin one. Combine the zones with your own confirmation and risk management; this tool highlights levels, it does not generate buy or sell signals.
DISCLAIMER
Nothing here is financial advice or a guarantee of any outcome. Past behaviour of price around order blocks does not predict future results. Always do your own research and manage risk. Penunjuk

Large Lot Reverse Engineer [JOAT]LARGE LOT REVERSE ENGINEER
A regression-driven block-trade detector that infers the implied size of an off-tape institutional order from the residual between price movement and volume — and turns that residual into an estimated lot count. The premise is straightforward: when a single large order moves price meaningfully more than the visible volume would justify, the gap is the size of the hidden order that absorbed the move. Large Lot Reverse Engineer models that relationship, flags the outliers, and estimates the size.
The core idea — what price movement is "worth"
In normal conditions there is a stable statistical relationship between volume and the magnitude of a bar's return. A rolling regression over a configurable window (default 60 bars) estimates expected volume as a function of return — i.e., for the move you just saw, how much volume should there have been?
The residual is the difference between actual and expected volume, Z-normalised by its own rolling stdev. Two signs of residual matter:
Implied block (residual Z ≥ +threshold) — more volume traded than the price move warrants. Someone large was on the passive side absorbing aggression. The direction of the bar tells you which side.
Thin market (residual Z ≤ −threshold) — price moved on suspiciously low volume. Liquidity was missing; the move was a low-conviction air-pocket.
Both reads are institutionally interesting. The first identifies absorbed-aggression — the textbook signature of an institutional block trade. The second identifies regimes where price prints are unreliable.
R² reliability gate
A regression is only meaningful when the underlying relationship is actually there. The script computes the rolling R² of the model and exposes a configurable minimum (default 0.10). When R² falls below the gate the model is considered unreliable; the dashboard cell turns warning-coloured and the script tags any signals fired in that regime as low-confidence. This is the difference between a real residual reading and a noise residual — a professional read forbids the same.
Significant block sizing
Three thresholds are stacked:
Implied Block Sigma (+) (default 2.0σ) — baseline implied-block trigger.
Thin Market Sigma (−) (default 2.0σ) — baseline thin-market trigger.
Significant Block Sigma (default 3.0σ) — above this the bar is rendered with a polygon glyph and gets an estimated lot-size badge . Empirical scaler converts residual-volume into a lot count.
The size unit is configurable: Shares/Coins for spot instruments, Notional USD for size in dollars (using a configurable price proxy), or Auto which picks based on instrument. The scaler is exposed because no single conversion factor is universally correct — calibrate to your instrument's typical notional.
Cluster detection
When N blocks fire inside a rolling window (configurable, default 3 in 5 bars) the Block Cluster alert fires. Cluster signals are the strongest read this script produces — they indicate sustained off-tape activity, not a single statistical outlier.
Visual system
Residual Z histogram — bars coloured bull/bear by direction, magnitude by residual.
Threshold lines at ±2 and ±3 with on/off toggle.
Zero line and significant-block polygon glyphs.
Thin-market dots in the muted palette.
Background recency fade — fresh blocks tint the background and decay to transparent over a configurable number of bars.
Cumulative implied delta (optional) — running sum of implied-block directional contributions, useful for reading sustained institutional bias.
A locked Carbon palette (neon green / neon red / white midline on carbon black) gives the pane an institutional terminal feel.
Dashboard
Monospaced table, positionable to any of nine corners, with a compact mode and optional legend footer. Surfaces:
Current residual Z value and sign.
R² value with reliability colour-coding (green / amber / red).
Last significant block direction with estimated lot size.
Block count and thin-market count in the recent window.
Cluster status with bars-since-last-cluster.
Cumulative implied delta (when enabled).
Alerts
Four alert conditions, each independently controllable:
Implied Buy Block (positive residual + up bar)
Implied Sell Block (positive residual + down bar)
Thin Market Event (negative residual)
Block Cluster (N-in-window)
How to read it
Three reads, in order of conviction:
Block Cluster + high R² — the highest-conviction read. Multiple statistically-significant blocks inside a window, with the underlying model reliable. Institutional flow is actively moving size.
Significant block (3σ+) at a known level — a single large polygon glyph at a key support/resistance is a textbook absorbed-print read. The lot-size badge gives you a magnitude proxy you can compare across bars.
Thin market warning — when the residual goes deeply negative, treat any move you see with extreme caution; the tape is hollow. Often precedes either a violent move once real flow returns or a fade back to fair value.
Suggested settings
Defaults (60-bar window, R² ≥ 0.10, ±2σ block, +3σ significant) are tuned for 5m–1H on liquid futures, FX, and large-cap equity. For lower timeframes drop the window to 30 and raise the sigma thresholds to 2.5σ / 3.5σ to filter noise. For daily and above, widen the window to 100+ and consider log returns for instruments with large price scales.
Originality
The implementation — the rolling return-vs-volume regression with R² gate, the residual-Z classifier with bidirectional thresholds, the empirical lot-size scaler with auto/notional unit switching, the polygon-glyph significant-block render, the thin-market dot variant, the N-in-window cluster trigger, the recency-fade background, and the cumulative implied delta — is JOAT-original. No third-party code reused. The "volume that should have been" inference pattern is well-known to institutional desks; the implementation here is purpose-built for chart-based bar data.
Limitations
Implied block size is an inference from residual statistics, not a direct read of off-tape trades. Pine cannot see actual block prints that occur away from the lit market; what the script flags is the visible footprint those prints leave behind. The lot-size badge depends on the empirical scaler, which must be calibrated per instrument — the default 1.0× is generic. The R² gate is the most important reliability filter; when R² is low, no signal in the model should be considered reliable, by construction.
-made with passion by jackofalltrades
Penunjuk

Channel Volume Profilwizard channel vp idm is a visual analysis tool built around a dynamic price channel, an anchored volume profile, value area levels, volume nodes, inducement zones, liquidity sweeps, and confluence labels.
the purpose of this indicator is to help traders read where price is positioned inside an active market structure. it combines channel direction, volume acceptance, value area behavior, and liquidity reactions into one clean visual layout.
this indicator does not predict the market. it is designed to organize technical analysis and highlight areas where price may react, slow down, reject, or continue.
main concept
the script builds a dynamic channel around price using a regression-based structure. inside this channel, it calculates an anchored volume profile that follows the slope of the market.
unlike a classic horizontal volume profile, this profile is projected inside the active channel. when the market is rising, the profile follows the upward slope. when the market is falling, the profile follows the downward slope.
this makes the profile easier to read in trending conditions, because the volume zones stay aligned with the current market path.
what the indicator displays
poc
poc stands for point of control. it marks the area with the highest volume inside the profile. this is often an area of acceptance where price may return, pause, or consolidate.
vah
vah stands for value area high. it is the upper boundary of the value area. if price rejects this level, a move back toward the poc may be watched. if price accepts above it, the market may be trying to expand higher.
val
val stands for value area low. it is the lower boundary of the value area. if price rejects this level, a move back toward the poc may be watched. if price accepts below it, the market may be trying to expand lower.
hvn
hvn stands for high volume node. it marks an area where volume concentration is high. these levels may act as areas of acceptance, reaction, or slowdown.
lvn
lvn stands for low volume node. it marks an area where volume concentration is low. these levels may act as fast movement zones, rejection zones, or imbalance areas.
idm
idm represents an internal inducement area. it helps identify internal liquidity zones that may be swept before a reaction or continuation.
drop marker
the drop marker highlights a possible liquidity sweep. it appears when price takes a level or zone and then moves back inside.
a label
the a label is a confluence marker. it combines several conditions such as sweep, rejection, value area interaction, volume behavior, poc reclaim, and structure context. it should not be used alone. it is a visual signal for deeper analysis.
how to use the indicator
start by looking at the channel direction.
if the channel is rising, the trader can focus more on reactions near the lower part of the channel, val, or bullish sweep zones.
if the channel is falling, the trader can focus more on reactions near the upper part of the channel, vah, or bearish sweep zones.
if price is near the middle of the channel, the market may be balanced. in that case, it is usually better to wait for a clear rejection, breakout, sweep, or acceptance shift.
how to use the poc
the poc is the main acceptance level of the current profile.
when price is above the poc, the market may be accepting higher prices.
when price is below the poc, the market may be accepting lower prices.
when price keeps returning to the poc, the market may be consolidating or building balance.
a clean break and hold above the poc can show stronger bullish acceptance.
a clean break and hold below the poc can show weaker structure or bearish acceptance.
how to use vah and val
vah and val define the value area.
a rejection from vah can show that price is failing to accept higher levels.
a rejection from val can show that price is failing to accept lower levels.
an acceptance above vah can suggest expansion to the upside.
an acceptance below val can suggest expansion to the downside.
beginners can use vah, poc, and val as a simple map:
vah = upper value zone
poc = balance zone
val = lower value zone
how to use hvn and lvn
hvn and lvn are displayed as small dotted levels with tiny labels.
hvn can act as a reaction or slowdown zone because price has previously accepted volume there.
lvn can act as a faster movement zone because there was less volume acceptance there.
these levels are not automatic buy or sell signals. they are reference points that should be combined with price action, structure, and risk management.
how to use idm
idm labels show internal inducement areas.
an idm can represent a zone where liquidity was built and later taken by the market. when price sweeps an idm and then reintegrates, it may help explain a reaction or shift in behavior.
an idm near val may support a bullish reaction if price sweeps and returns inside the channel.
an idm near vah may support a bearish reaction if price sweeps and returns inside the channel.
how to use the drop marker
the drop marker shows a potential liquidity sweep.
a drop below val or below the lower channel can suggest that price swept lower liquidity and then returned inside.
a drop above vah or above the upper channel can suggest that price swept upper liquidity and then returned inside.
it is usually better to wait for candle close before interpreting the marker.
how to use the a label
the a label represents a stronger confluence condition.
a bullish a near val or the lower channel can suggest possible absorption if price sweeps liquidity and closes back inside.
a bearish a near vah or the upper channel can suggest possible distribution if price sweeps liquidity and closes back inside.
the a label becomes more meaningful when it appears near poc, vah, val, hvn, lvn, or idm.
it should always be confirmed with market context, candle close, and risk management.
important settings
channel / vp lookback
controls how many bars are used for the channel and the volume profile. a higher value gives a broader view. a lower value gives a more reactive view.
regression length
controls the base of the channel. a higher value makes the channel smoother. a lower value makes it react faster to recent price movement.
vp rows
controls the number of rows in the volume profile. more rows create more detail, but too many rows can make the chart heavier.
value area %
controls the value area calculation. the common default is 70.
poc source
chooses how the poc is calculated. raw is stricter. smoothed is more stable visually.
vah / val source
chooses whether value area boundaries use raw volume or smoothed volume.
keep vp / levels inside rails
keeps the volume profile and main levels inside the channel so they do not overlap the outer rail visuals.
auto guard from neon rails
adds extra spacing from the visual rail bands to keep the profile and levels clean.
show inner lines
shows or hides decorative inner channel lines. when disabled, inner decorative lines are removed, while important levels such as poc, vah, val, hvn, and lvn remain visible.
show hvn / lvn small lines
shows small dotted high volume node and low volume node markers.
idm validation mode
controls how idm labels are displayed.
balanced sweep is more flexible.
strict bos is more selective.
early candidate displays potential idm areas earlier.
a minimum score
controls how selective the a label is. a higher value gives fewer signals. a lower value gives more signals.
beginner workflow
step 1
identify the channel direction.
if the channel is rising, focus on bullish reactions near the lower channel, val, or sweep zones.
if the channel is falling, focus on bearish reactions near the upper channel, vah, or sweep zones.
step 2
check where price is compared to the poc.
above poc can show stronger acceptance.
below poc can show weaker acceptance.
around poc can show balance or consolidation.
step 3
watch vah and val.
vah is the upper value boundary.
val is the lower value boundary.
look for rejection, acceptance, or sweep around these levels.
step 4
use hvn and lvn as reaction levels.
hvn may slow price down.
lvn may lead to faster movement or sharp rejection.
step 5
wait for confirmation.
a drop marker shows a sweep.
an a label shows confluence.
an idm label shows internal liquidity.
when several elements appear in the same area, that zone becomes more important for analysis.
example use case
price is rising inside the channel.
price pulls back toward val.
a drop marker appears below val.
price closes back inside the channel.
an a label appears near the lower channel.
in this case, the trader can study the area as a possible bullish reaction zone. this does not mean automatic entry. the trader should still check market structure, candle close, risk, and invalidation level.
another example
price reaches the upper channel and trades near vah.
a drop marker appears above vah.
price closes back below vah.
an a label appears near the top of the channel.
this can be studied as a possible rejection zone. the trader should still confirm with structure, risk management, and broader market direction.
usage tips
do not use the indicator alone.
always check the broader trend.
wait for candle close before making a decision.
avoid trading every label.
focus on zones where several elements align.
adjust settings depending on the asset and timeframe.
use proper risk management.
test the indicator before using it in live conditions.
risk notice
this indicator is an educational and technical analysis tool. it is not financial advice and does not guarantee any result. all signals and levels should be used as visual references inside a complete trading plan. every trader is responsible for their own decisions, risk management, and execution.
Penunjuk

Smart Volume Profile VPVR POC, Value Area, SR [LunqFX]Smart Volume Profile VPVR is a modern, professional-grade volume profile indicator for TradingView that turns raw traded volume into the cleanest possible map of where the market actually did business. It plots the Point of Control (POC), the full 70% Value Area (VAH / VAL), and every High and Low Volume Node (HVN / LVN) as glowing, easy-to-read horizontal support and resistance levels — on any symbol and any timeframe: forex, crypto, stocks, indices, futures, gold (XAUUSD), Bitcoin (BTCUSD), NASDAQ, S&P 500, oil and more. Unlike a plain histogram, this VPVR (Volume Profile Visible Range) tool layers a live order-flow dashboard on top that reads the market in real time and tells you whether price is accepting value, rejecting value, rotating back to fair value, or breaking out — the exact context that separates profitable volume-profile trading from guessing. Built entirely in Pine Script v6 with neon gradient candles and a fully readable, gradient-coloured profile, it is designed to be both beautiful and genuinely useful for day trading, scalping, swing trading and intraday analysis.
◆ WHY VOLUME PROFILE MATTERS
Most indicators are based on price and time. Volume profile is based on price and volume — it answers a completely different and more important question: at which prices did the most trading actually happen? Those prices are where institutions, liquidity and "fair value" concentrate. High-volume areas act as magnets and strong support/resistance; low-volume areas are vacuums that price rips through. By making this structure obvious, Smart Volume Profile helps you trade with the auction instead of against it.
◆ WHAT IT DRAWS ON THE CHART
POC — Point of Control (gold ray): the single most-traded price in the window. This is the market's fairest value and its strongest magnet. Price returns to the POC again and again; it is the most important pivot on the chart.
VAH / VAL — Value Area High & Low (dashed rays): the top and bottom of the zone that contains 70% of all traded volume (fully configurable, 40–95%). Inside this band the market is "comfortable"; outside it the market is in discovery / imbalance.
High Volume Nodes (HVN): thick, bright rows = heavy acceptance = strong support & resistance and reaction/reversal zones.
Low Volume Nodes (LVN): thin, dim rows = rejection / fast-move zones where price tends to travel quickly and gap.
Gradient histogram: every row is colour-graded by its volume, so the profile literally glows where volume is heaviest — you read the structure at a glance instead of squinting at bars.
All levels extend as live rays with clean, high-contrast labels showing the exact price.
◆ THE LIVE DASHBOARD PANEL (this is what makes it "Smart")
A plain volume profile just draws lines. This indicator adds a compact, modern analytics panel that computes context you cannot see on the chart and condenses it into one glance:
Signal — the headline call, colour-coded: ▲ LONG revert, ▼ SHORT revert, ▲ BREAKOUT, ▼ BREAKDOWN, or ● BALANCED. This is the playbook for the current moment (logic explained below).
→ POC — the live distance from current price to the Point of Control, in %. This is your mean-reversion target and a quick read of how stretched price is from fair value.
In VA — a clean segmented meter showing where price currently sits inside the value area (from VAL on the left to VAH on the right). Instantly tells you if you're at the top, middle, or bottom of value.
Acceptance — the split of volume traded above vs below the POC (e.g. 52% ▼ / ▲ 48%). Reveals which side the market is building value on — a directional bias the chart hides.
Pressure — a segmented meter of buy volume vs sell volume across the whole window. Shows whether buyers or sellers are in control of the auction.
Footer — the lookback size and the actual % of volume captured by the value area, so you always know the context behind the numbers.
The panel is fully themeable (position, background, accent) and stays readable on dark charts.
◆ HOW IT WORKS (under the hood)
Binning: the chosen lookback window is divided into price rows ("buckets"). Resolution is adjustable for coarse or razor-sharp profiles.
True volume distribution: instead of dumping each bar's volume at its close, the indicator can spread each bar's volume across every price it actually traded through (high→low), producing a far more accurate profile than close-only methods.
POC detection: the row with the maximum accumulated volume becomes the Point of Control — by construction always the longest bar in the histogram.
Value Area expansion: starting from the POC, the algorithm steps outward toward whichever neighbouring row holds more volume, accumulating until the target (default 70%) of total volume is enclosed. The final boundaries become VAH and VAL — the same methodology used in classic Market Profile.
Order-flow analytics: the script measures volume above vs below the POC (Acceptance) and buy-bar vs sell-bar volume (Pressure) across the window.
Smart Signal engine: it blends Acceptance and Pressure into a single order-flow reading and combines it with price location relative to the value area to classify the situation as a rotation or a breakout (see below).
◆ THE SMART SIGNAL LOGIC
A naive volume-profile tool always says "revert to POC", which gets you run over in trends. This one is smarter:
Price BELOW value + order flow NOT confirming the drop → ▲ LONG revert (rotation back to POC).
Price BELOW value + order flow confirming the drop → ▼ BREAKDOWN (continuation — don't catch the knife).
Price ABOVE value + order flow NOT confirming the push → ▼ SHORT revert (rotation back to POC).
Price ABOVE value + order flow confirming the push → ▲ BREAKOUT (continuation — trade with it).
Price INSIDE value → ● BALANCED (range conditions — fade the edges back toward POC).
This single distinction — rotation vs breakout — is the difference between fading a pullback and getting trapped against a trend.
◆ HOW TO USE IT
Mean-reversion / range trading: in BALANCED or revert states, fade moves at VAH/VAL back toward the POC. The → POC distance is your target; HVN rows are logical stop zones.
Breakout / trend trading: in BREAKOUT / BREAKDOWN states, trade in the direction of the move and target the next HVN. Avoid counter-trend fades when order flow confirms the break.
Support & resistance mapping: treat thick HVN rows as high-probability reaction zones and expect rapid, low-resistance moves through LVN gaps.
Bias & confluence: use Acceptance and Pressure for directional bias, and combine the POC/VAH/VAL levels with your own structure, liquidity, order blocks or session tools for higher-conviction entries.
Multi-timeframe: raise the Lookback for higher-timeframe value (swing context), lower it for intraday/scalping context. Increase Rows for more precise POC placement.
◆ SETTINGS
Volume Profile Engine: Lookback (bars), Rows (resolution), Value Area %, true-range volume distribution toggle.
Profile Look: width, gap from price, anchor side (right of price / classic overlay), Value-Area / outside / POC colours.
Levels: POC ray, VAH/VAL rays, optional Value-Area shading, ray extension, label size (Small → Huge).
Neon Candles: gradient candles (turquoise bullish / magenta bearish) with momentum-scaled glow halo.
Panel: show/hide, position, background and accent colour.
◆ ALERTS
Price crossed POC
Breakout above VAH
Breakdown below VAL
◆ NON-REPAINTING
The profile, levels and dashboard are single objects rendered on the last bar over a fixed rolling lookback — historical bars are never repainted. As with any live tool, the current bar is included in the calculation, so the real-time read updates tick by tick and settles on close; closed history never changes.
Smart Volume Profile VPVR is an educational analysis tool, not financial advice. Volume profile reflects historical traded volume and does not predict future prices. Always do your own research and manage risk. © LunqFX.
Penunjuk