Valuation Z-Score
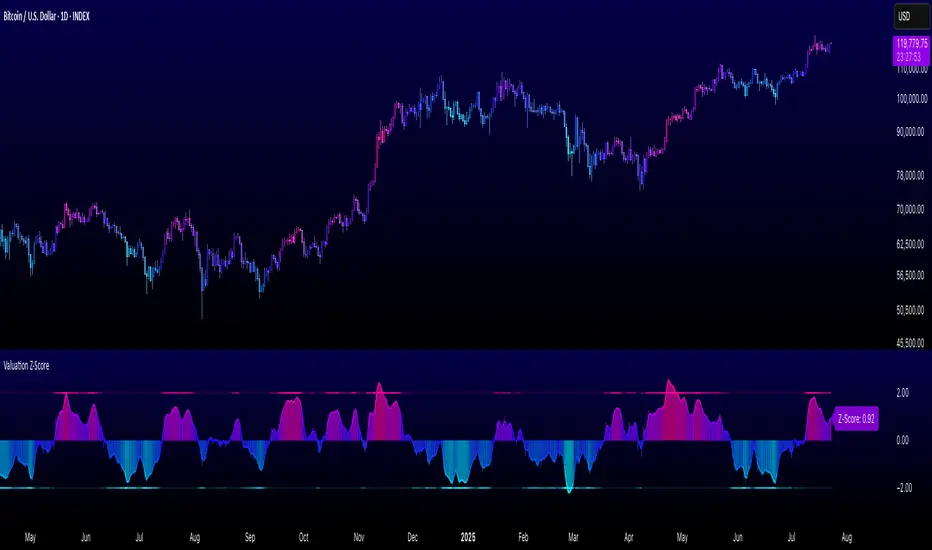
The "Valuation Z-Score" indicator is a custom Pine Script designed to assess the valuation of an asset, such as Bitcoin, by calculating a composite Z-Score based on multiple technical indicators and risk-adjusted performance metrics. It provides a visual representation of overbought and oversold conditions using a color-graded histogram and a short length smoothed moving average (SMA).
Key Features:
Z-Score Calculation:
- Combines Z-Scores from indicators like RSI, MACD, Bollinger Bands, TSI, ROC, Momentum, CCI, Chande Momentum Oscillator, and additional metrics (Sharpe Ratio, Sortino Ratio, Omega Ratio) over customizable lookback periods.
Customizable Inputs:
- Z-Score Lookback and Technical Valuation Lookback for Z-Score calculations.
- Metrics Calc Lookback periods for risk-adjusted performance ratios.
- Adjustable Upper and Lower Z-Score Thresholds (default ±2.0).
- SMA Length and color bar toggle for plot customization.
Visualization:
- A histogram displays the total Z-Score with a 5-color gradient (cyan for oversold, magenta for overbought) and dynamic transparency based on proximity to thresholds.
- An SMA line/area overlays the histogram for trend smoothing.
- Threshold lines (upper and lower) with adaptive transparency.
- A label shows the current Z-Score value.
- Optional background bar coloring based on SMA.
Usage:
- The indicator helps identify potential overbought (above upper threshold) or oversold (below lower threshold) conditions.
- The color gradient and SMA provide visual cues for trend strength and reversals.
- Ideal for traders analyzing asset valuation over any timeframe.
Skrip jemputan sahaja
Hanya pengguna yang diluluskan oleh penulis boleh mengakses skrip ini. Anda perlu memohon dan mendapatkan kebenaran untuk menggunakannya. Ini selalunya diberikan selepas pembayaran. Untuk lebih butiran, ikuti arahan penulis di bawah atau hubungi terus QuantPablo.
TradingView tidak menyarankan pembayaran untuk atau menggunakan skrip kecuali anda benar-benar mempercayai penulisnya dan memahami bagaimana ia berfungsi. Anda juga boleh mendapatkan alternatif sumber terbuka lain yang percuma dalam skrip komuniti kami.
Arahan penulis
Amaran: sila baca panduan kami untuk skrip jemputan sahaja sebelum memohon akses.
Penafian
Skrip jemputan sahaja
Hanya pengguna yang diluluskan oleh penulis boleh mengakses skrip ini. Anda perlu memohon dan mendapatkan kebenaran untuk menggunakannya. Ini selalunya diberikan selepas pembayaran. Untuk lebih butiran, ikuti arahan penulis di bawah atau hubungi terus QuantPablo.
TradingView tidak menyarankan pembayaran untuk atau menggunakan skrip kecuali anda benar-benar mempercayai penulisnya dan memahami bagaimana ia berfungsi. Anda juga boleh mendapatkan alternatif sumber terbuka lain yang percuma dalam skrip komuniti kami.
Arahan penulis
Amaran: sila baca panduan kami untuk skrip jemputan sahaja sebelum memohon akses.