OPEN-SOURCE SCRIPT
Telah dikemas kini Sveezy BTC Level Sync
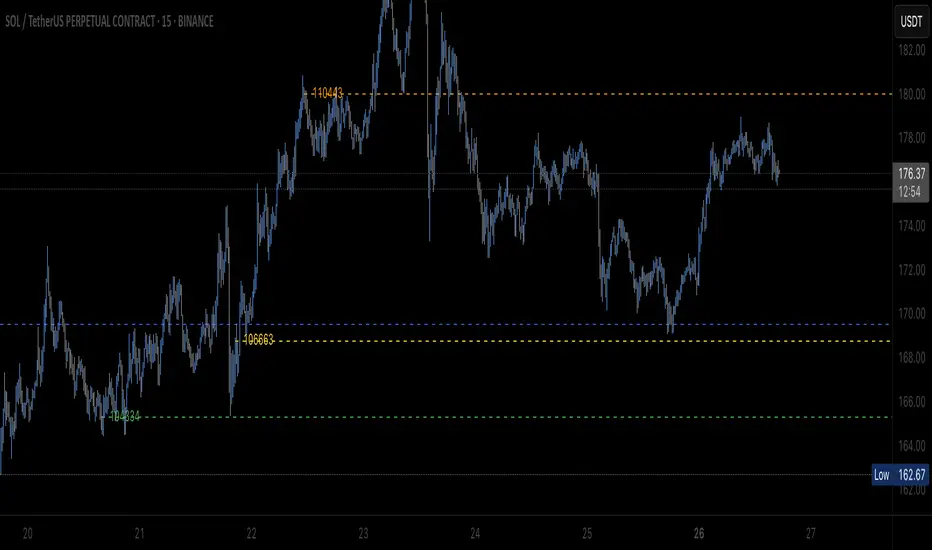
This indicator lets you define up to 5 key Bitcoin price levels (support or resistance zones). Whenever BTC “touches” (crosses up) one of those levels on your chosen exchange, the script records the exact bar, then on any non-BTC chart it draws a dashed horizontal line at that asset’s price at the same moment in time. You can optionally display a plain-text BTC-level label, right-justified a configurable number of bars to the right of each line.
Features:
- 5 user-defined BTC levels via separate inputs
- Time-synced across symbols: marks altcoin price on the exact bar BTC hit the level
- Most recent touch only: lines update when BTC crosses the same level again
- Right-justified labels: plain text (no box) showing the BTC level, offset by bars & ticks
- Lightweight: uses only built-in line and label primitives, no heavy loops
How to Use:
- Open any altcoin chart (ETH, SOL, your token).
- Add the indicator from Pine Editor (paste and save).
- Enter your BTC symbol and up to 5 levels.
- Enable labels if desired; adjust offsets.
- Watch dashed lines plot at your alt’s price every time BTC crosses a level.
Ideal For:
- Pair traders who want to sync entries/exits to BTC key levels
- Arbitrageurs scanning multiple alt charts for BTC-driven swings
- Anyone wishing to visualize how alts responded at specific BTC prices
Feel free to fork and customize further (cross-down detection, color schemes, multi-timeframe support). If you find it helpful, drop a comment or upvote!
Nota Keluaran
This indicator tracks the most recent time Bitcoin crossed each of five user-defined price levels, then on any altcoin chart it draws a right-extended, dashed line at the price that altcoin was trading when BTC last hit those levels. Optionally, it can display a simple text label immediately to the right of each line showing the BTC level—making it effortless to see exactly how alts reacted at BTC’s last touch of key support or resistance.How to Use it:
1. Apply the indicator from the Public Library onto any altcoin chart (ETH, SOL, ADA, etc.).
2. Open the indicator’s settings and set:
- BTC Symbol (e.g. BINANCE:BTCUSDT)
- BTC Level 1–5 (your target support/resistance prices)
- Show Level Labels on/off
- Label Vertical Offset (ticks) and Horizontal Offset (bars)
3. Watch for lines: each time BTC crosses one of your levels (from below), the script records that bar as the “last touch,” and on your alt chart draws a dashed line at the alt’s price from that moment forward.
4. If labels are enabled, the exact BTC level appears as plain text just to the right of each line.
Use this to synchronize alt-coin entries, exits, or analysis directly to the last BTC touch of your key levels—no manual chart juggling needed.
Feel free to fork and customize further (cross-down detection, color schemes, multi-timeframe support). If you find it helpful, drop a comment or upvote!
Skrip sumber terbuka
Dalam semangat TradingView sebenar, pencipta skrip ini telah menjadikannya sumber terbuka, jadi pedagang boleh menilai dan mengesahkan kefungsiannya. Terima kasih kepada penulis! Walaupuan anda boleh menggunakan secara percuma, ingat bahawa penerbitan semula kod ini tertakluk kepada Peraturan Dalaman.
Penafian
Maklumat dan penerbitan adalah tidak bertujuan, dan tidak membentuk, nasihat atau cadangan kewangan, pelaburan, dagangan atau jenis lain yang diberikan atau disahkan oleh TradingView. Baca lebih dalam Terma Penggunaan.