OPEN-SOURCE SCRIPT
Bollinger Bands Fibonacci ratios
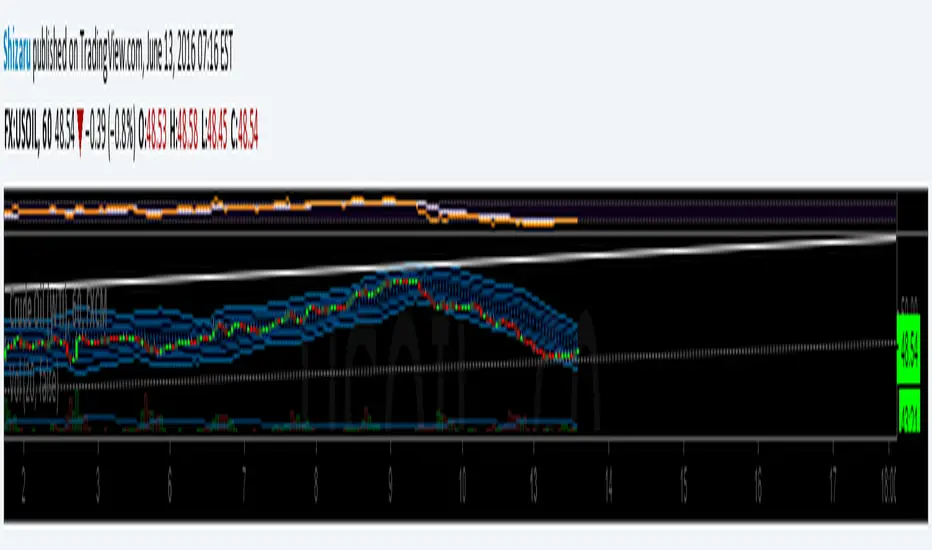
The Fibonacci Bollinger Bands indicator is based on the same principles as the standard Bollinger Bands indicator developed by John Bollinger. The Fibonacci Bollinger Bands indicator bases its upper and lower bands on volatility just like the Bollinger Bands indicator does, but instead of using standard deviation as the measure of volatility, a Wilders Smoothed ATR is used in its place.
The middle band is a moving average used to establish the intermediate-term trend. The 3 upper bands are constructed by using the Wilders Smoothed ATR and multiplying it by each of the Fibonacci factors (1.618, 2.618, and 4.236) and then adding the results to the middle band. The 3 lower bands are constructed in the same manner as the upper bands except their results are subtracted from the middle band.
The middle band is a moving average used to establish the intermediate-term trend. The 3 upper bands are constructed by using the Wilders Smoothed ATR and multiplying it by each of the Fibonacci factors (1.618, 2.618, and 4.236) and then adding the results to the middle band. The 3 lower bands are constructed in the same manner as the upper bands except their results are subtracted from the middle band.
Skrip sumber terbuka
Dalam semangat sebenar TradingView, pencipta skrip ini telah menjadikannya sumber terbuka supaya pedagang dapat menilai dan mengesahkan kefungsiannya. Terima kasih kepada penulis! Walaupun anda boleh menggunakannya secara percuma, ingat bahawa menerbitkan semula kod ini adalah tertakluk kepada Peraturan Dalaman kami.
Penafian
Maklumat dan penerbitan adalah tidak dimaksudkan untuk menjadi, dan tidak membentuk, nasihat untuk kewangan, pelaburan, perdagangan dan jenis-jenis lain atau cadangan yang dibekalkan atau disahkan oleh TradingView. Baca dengan lebih lanjut di Terma Penggunaan.