PROTECTED SOURCE SCRIPT
Telah dikemas kini Risk On/Off Index [SwissAlgo]
Risk On/Off Index [SwissAlgo] - Sector Rotation Analysis
----------------------------------------------------
What it does:
This indicator estimates market risk appetite by comparing the weighted performance of growth/cyclical sectors (Risk-On) against defensive sectors (Risk-Off).
It provides a normalized oscillator that ranges from -1 (extreme risk-off) to +1 (extreme risk-on), which may help traders identify potential shifts in market sentiment and sector rotation patterns.
The analysis examines whether institutional money flows favor aggressive growth assets or seek safety in defensive positions, potentially offering insights into the underlying risk tolerance that drives market movements. When properly interpreted alongside other analyses, this information could assist in understanding broader market cycles and sentiment transitions.
----------------------------------------------------
How it works:
The indicator analyzes 11 major sector ETFs weighted by their actual market capitalization representation:
Risk-On sectors (70% weight): Technology (28%), Financials (11%), Consumer Discretionary (10%), Communication (9%), Industrials (8%), Energy (4%), Materials (2.5%), Real Estate (2%)
Risk-Off sectors (30% weight): Healthcare (13%), Consumer Staples (6%), Utilities (2.5%)
The algorithm calculates the weighted performance difference over your selected timeframe (7 days to 12 months) and normalizes it using three methods: Simple Difference, Tanh Normalized, or Historical Range. A 7-period EMA smooths the signal, while a longer signal line (default 50) provides trend context.
----------------------------------------------------
Visual Features:
This color system allows traders to quickly assess not just current sentiment (above/below zero) but also whether that sentiment is strengthening or potentially reversing based on the relationship with the signal line.
----------------------------------------------------
Who may benefit:
----------------------------------------------------
Key applications:
----------------------------------------------------
Limitations:
This indicator reflects US equity sector dynamics and may not capture risk sentiment in other asset classes or geographic regions. ETF-based analysis introduces slight tracking differences from underlying sector performance. Past performance patterns do not guarantee future results.
----------------------------------------------------
Disclaimer:
This indicator is for educational and analytical purposes only. It does not constitute financial advice or trading recommendations. Users should conduct their own analysis and risk assessment before making investment decisions. SwissAlgo assumes no responsibility for trading losses or investment outcomes based on this indicator's signals.
----------------------------------------------------
What it does:
This indicator estimates market risk appetite by comparing the weighted performance of growth/cyclical sectors (Risk-On) against defensive sectors (Risk-Off).
It provides a normalized oscillator that ranges from -1 (extreme risk-off) to +1 (extreme risk-on), which may help traders identify potential shifts in market sentiment and sector rotation patterns.
The analysis examines whether institutional money flows favor aggressive growth assets or seek safety in defensive positions, potentially offering insights into the underlying risk tolerance that drives market movements. When properly interpreted alongside other analyses, this information could assist in understanding broader market cycles and sentiment transitions.
----------------------------------------------------
How it works:
The indicator analyzes 11 major sector ETFs weighted by their actual market capitalization representation:
Risk-On sectors (70% weight): Technology (28%), Financials (11%), Consumer Discretionary (10%), Communication (9%), Industrials (8%), Energy (4%), Materials (2.5%), Real Estate (2%)
Risk-Off sectors (30% weight): Healthcare (13%), Consumer Staples (6%), Utilities (2.5%)
The algorithm calculates the weighted performance difference over your selected timeframe (7 days to 12 months) and normalizes it using three methods: Simple Difference, Tanh Normalized, or Historical Range. A 7-period EMA smooths the signal, while a longer signal line (default 50) provides trend context.
----------------------------------------------------
Visual Features:
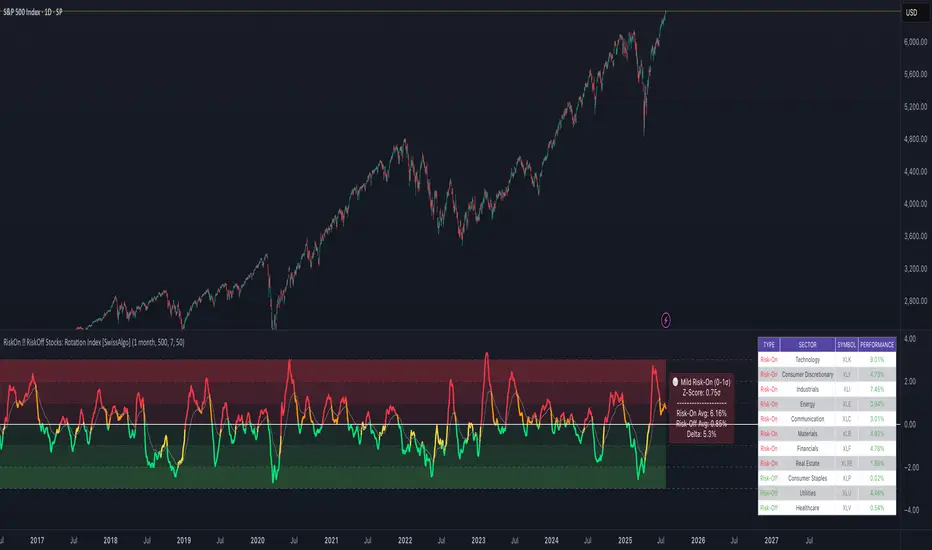
- Main curve (Risk Appetite Delta): The primary line shows the smoothed (7-period EMA) risk appetite reading. When above zero, growth sectors are outperforming defensive sectors (risk-on sentiment). When below zero, defensive sectors are outperforming growth sectors (risk-off sentiment).
- Signal line: A longer EMA (default 50-period) of the risk appetite data that represents the underlying trend. Crossovers between the main curve and signal line may indicate potential momentum shifts in market sentiment (potential long signal when the crossover happens in extreme risk-off zones, and potential short signal when the crossunder occurs in extreme risk-on zones)
- Dynamic color coding: The main curve color reflects both position and momentum:
Red: Risk-on territory (>0) with strengthening momentum (above signal line)
Green: Risk-on territory (>0) but weakening momentum (below signal line) - potential reversal warning
Maroon: Risk-off territory (<0) but strengthening momentum (above signal line) - potential reversal warning
Lime: Risk-off territory (<0) with strengthening momentum (below signal line) - Gradient background zones: Subtle fills indicate risk appetite intensity levels from moderate (0 to ±0.25) through strong (±0.25 to ±0.5) to extreme (±0.5 to ±1.0)
- Sector breakdown table: Shows individual sector performance with clear Risk-On/Risk-Off categorization
- Reference levels: Horizontal lines mark neutral (0), strong (±0.5), and extreme (±1) risk appetite zones
This color system allows traders to quickly assess not just current sentiment (above/below zero) but also whether that sentiment is strengthening or potentially reversing based on the relationship with the signal line.
----------------------------------------------------
Who may benefit:
- Portfolio managers rotating between growth and defensive allocations
- Swing traders timing sector rotation plays
- Risk managers monitoring overall market sentiment
- Asset allocators adjusting exposure based on risk appetite cycles
----------------------------------------------------
Key applications:
- Identify when markets transition from growth-seeking to risk-averse behavior
- Time entries into cyclical sectors during risk-on phases
- Rotate to defensive sectors when risk appetite weakens
- Spot divergences between individual stocks and broader market sentiment
----------------------------------------------------
Limitations:
This indicator reflects US equity sector dynamics and may not capture risk sentiment in other asset classes or geographic regions. ETF-based analysis introduces slight tracking differences from underlying sector performance. Past performance patterns do not guarantee future results.
----------------------------------------------------
Disclaimer:
This indicator is for educational and analytical purposes only. It does not constitute financial advice or trading recommendations. Users should conduct their own analysis and risk assessment before making investment decisions. SwissAlgo assumes no responsibility for trading losses or investment outcomes based on this indicator's signals.
Nota Keluaran
Set def. look back at 30-day, to capture early rotationNota Keluaran
Updated RiskOn ⇋ RiskOff Stocks: Rotation Index visualization based on Z-Score approachSkrip dilindungi
Skrip ini diterbitkan sebagai sumber tertutup. Akan tetapi, anda boleh menggunakannya secara bebas dan tanpa apa-apa had – ketahui lebih di sini.
Penafian
Maklumat dan penerbitan adalah tidak bertujuan, dan tidak membentuk, nasihat atau cadangan kewangan, pelaburan, dagangan atau jenis lain yang diberikan atau disahkan oleh TradingView. Baca lebih dalam Terma Penggunaan.
Skrip dilindungi
Skrip ini diterbitkan sebagai sumber tertutup. Akan tetapi, anda boleh menggunakannya secara bebas dan tanpa apa-apa had – ketahui lebih di sini.
Penafian
Maklumat dan penerbitan adalah tidak bertujuan, dan tidak membentuk, nasihat atau cadangan kewangan, pelaburan, dagangan atau jenis lain yang diberikan atau disahkan oleh TradingView. Baca lebih dalam Terma Penggunaan.