aex

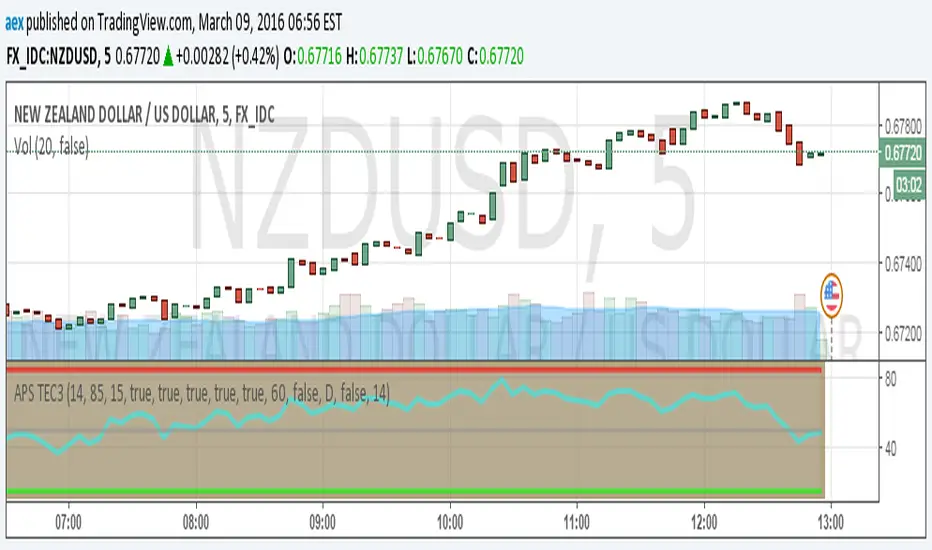
APS TEC3

43
rsi peaks
Skrip sumber terbuka

Dalam semangat TradingView yang sebenar, penulis skrip ini telah menerbitkannya dengan menggunakan sumber terbuka supaya pedagang-pedagang dapat memahami dan mengesahkannya. Sorakan kepada penulis! Anda dapat menggunakannya secara percuma tetapi penggunaan semula kod ini dalam penerbitan adalah dikawalselia oleh Peraturan Dalaman. Anda boleh menyukainya untuk menggunakannya pada carta.

Penafian

Maklumat dan penerbitan adalah tidak dimaksudkan untuk menjadi, dan tidak membentuk, nasihat untuk kewangan, pelaburan, perdagangan dan jenis-jenis lain atau cadangan yang dibekalkan atau disahkan oleh TradingView. Baca dengan lebih lanjut di Terma Penggunaan.

Ingin menggunakan skrip ini pada carta?
//Created By APS on 28/12/2015
///RSI with ability to change first RSI to a different Timeframe.
//different Timeframes on same chart

study(title="APS TEC3", shorttitle="APS TEC3", precision=0)
src = close
len = input(14, minval=1, title="Length")
upLine = input(85, minval=0, maxval=100, title="Upper Line Value?")
lowLine = input(15, minval=0, maxval=100, title="Lower Line Value?")
sml = input(true, title="Show Mid Line?")
sbh = input(true, title="Show Back Ground Highlights When RSI is Above/Below High/Low Lines?")
sch = input(true, title="Show Back Ground Highlights When RSI Cross?")
sl = input(true, title="Show 'B' and 'S' Letters When RSI Crosses High/Low Line?")
useCurrentRes = input(true, title="Use Current Chart Resolution?")
resCustom = input(title="Use Different Timeframe? Uncheck Box Above", type=resolution, defval="60")
ssRSI = input(false, title="Show 2nd RSI?")
resCustom2 = input(title="Use 2nd RSI? Check Box Above", type=resolution, defval="D")
useCurrentRes2 = input(false, title="Use 2nd RSI Plot On Samet Timeframe?")
len2 = input(14, minval=1, title="2nd RSI Length")

res = useCurrentRes ? period : resCustom
res2 = useCurrentRes2 ? period : resCustom2

up = rma(max(change(src), 0), len)
down = rma(-min(change(src), 0), len)
rsi = down == 0 ? 100 : up == 0 ? 0 : 100 - (100 / (1 + up / down))
outRSI = security(tickerid, res, rsi)

up2 = rma(max(change(src), 0), len2)
down2 = rma(-min(change(src), 0), len2)
rsi2 = down2 == 0 ? 100 : up2 == 0 ? 0 : 100 - (100 / (1 + up2 / down2))
outRSI2 = security(tickerid, res2, rsi2)

aboveLine = outRSI < upLine ? 1 : 0
belowLine = outRSI > lowLine ? 1 : 0
crossUp = outRSI[1] <  lowLine and outRSI > upLine ? 1 : 0
crossDn = outRSI[1] >  upLine and outRSI < lowLine ? 1 : 0

bgcolor(sbh and aboveLine ? red : na, transp=70)
bgcolor(sbh and belowLine ? green : na, transp=70)
bgcolor(sch and crossUp ? lime : na, transp=40)
bgcolor(sch and crossDn ? red : na, transp=40)

plot(outRSI, title="RSI", style=line, linewidth=3, color=aqua)
plot(ssRSI and outRSI2 ? outRSI2 : na, title="2nd RSI - Different Time Frame?", style=linebr, linewidth=4, color=orange)
p1 = plot(upLine, title= "Upper Line", style=solid, linewidth=3, color=red)
p2 = plot(lowLine, title= "Lower Line", style=solid, linewidth=3, color=lime)
plot(sml and 50 ? 50 : na, title="Mid Line", style=linebr, linewidth=2, color=gray)
plotchar(sl and crossUp ? crossUp : na, title="Buy Signal", char='B', location=location.bottom, color=lime, transp=0, offset=0)
plotchar(sl and crossDn ? crossDn : na, title="Sell Signal", char='S', location=location.top, color=red, transp=0, offset=0)
fill(p1, p2, color=silver, transp=70)