OPEN-SOURCE SCRIPT
Telah dikemas kini Absolute KRI [vnhilton]
The Kairi Relative Index (KRI) is a volatility momentum oscillator that plots the distance of price away from a moving average. An increase or decrease in distance is a sign of increasing/decreasing momentum respectively, & a relatively stable distance would mean momentum is also stable. An increase in momentum is a sign of strength, price extending away from the moving average, & has to revert back to the mean sooner than later, which is why some traders look to take profit or contrarian trades with this increase in momentum.
This indicator plots the KRI in absolute values, meaning that the value can never be lower than 0, helping to see momentum clearer, with colours to still give information on whether or price is in an uptrend or downtrend if it's above/below the moving average respectively. This indicator also includes a standard deviation band, to help spot abnormal distances between price & the moving average, which may be more worthy of attention as that's a sign of significant activity that's caused momentum.
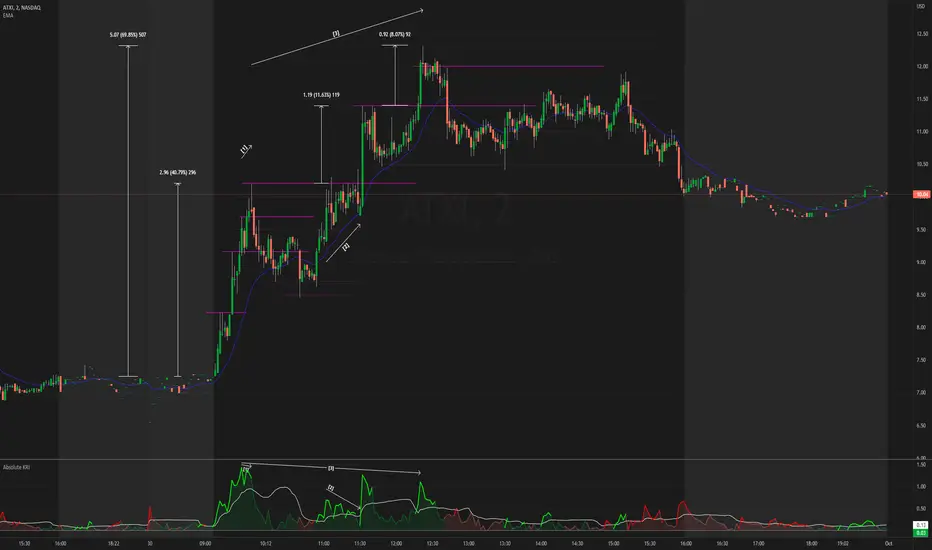
The chart snapshot image above shows ATXI moving ~70% from its open on 30/09/22. From open to midday, we can see price extend away from the 21 EMA (impulses) several times, with retracements back towards the EMA following right after. Let's look at 3 main examples of price creating new highs.
- At (1), price attempts to make a new high, & but meets historical resistance, causing price to retrace back to the mean. On the indicator, you can see momentum failing to be higher than previous momentum after making new highs, which shows that historical resistance, alongside the whole $10 dollar level, were significant in causing a reversal (you can see sell volume using the periodic volume profile (pvp) for each bar). The indicator also shows momentum extending further than the standard deviation band, which is mostly expected as it's right at the open & the stock was in play at the time. The indicator falls back under the standard deviation band which confirms the retracement, as it's showing slowing of momentum.
- At (2), the indicator indicates significant activity again after exiting the standard deviation band, with the impulse slowing down right the resistance, testing it several times to satisfy passive sellers, until aggressive buyers were able to push the price higher. This confirmed new high that followed afterwards didn't exhibit the same momentum as (1), which means that the overall trend is slowing down, meaning that traders should be more cautious of trying to buy into new highs (i.e. take profit earlier, & look for reversals).
- At (3), the indicator shows significant activity again as price heads towards making a new high. As new highs were created, we can see that the momentum causing this breakout is lower than the previous momentum at (2) & (1), again showing that the overall trend is slowing down. The whole $12 dollar level, & FOMO/greed buyers being trapped at the wick (you can see buy volume using the pvp indicator), allowed for short-term resistance for a mean reversion play.
This indicator plots the KRI in absolute values, meaning that the value can never be lower than 0, helping to see momentum clearer, with colours to still give information on whether or price is in an uptrend or downtrend if it's above/below the moving average respectively. This indicator also includes a standard deviation band, to help spot abnormal distances between price & the moving average, which may be more worthy of attention as that's a sign of significant activity that's caused momentum.
The chart snapshot image above shows ATXI moving ~70% from its open on 30/09/22. From open to midday, we can see price extend away from the 21 EMA (impulses) several times, with retracements back towards the EMA following right after. Let's look at 3 main examples of price creating new highs.
- At (1), price attempts to make a new high, & but meets historical resistance, causing price to retrace back to the mean. On the indicator, you can see momentum failing to be higher than previous momentum after making new highs, which shows that historical resistance, alongside the whole $10 dollar level, were significant in causing a reversal (you can see sell volume using the periodic volume profile (pvp) for each bar). The indicator also shows momentum extending further than the standard deviation band, which is mostly expected as it's right at the open & the stock was in play at the time. The indicator falls back under the standard deviation band which confirms the retracement, as it's showing slowing of momentum.
- At (2), the indicator indicates significant activity again after exiting the standard deviation band, with the impulse slowing down right the resistance, testing it several times to satisfy passive sellers, until aggressive buyers were able to push the price higher. This confirmed new high that followed afterwards didn't exhibit the same momentum as (1), which means that the overall trend is slowing down, meaning that traders should be more cautious of trying to buy into new highs (i.e. take profit earlier, & look for reversals).
- At (3), the indicator shows significant activity again as price heads towards making a new high. As new highs were created, we can see that the momentum causing this breakout is lower than the previous momentum at (2) & (1), again showing that the overall trend is slowing down. The whole $12 dollar level, & FOMO/greed buyers being trapped at the wick (you can see buy volume using the pvp indicator), allowed for short-term resistance for a mean reversion play.
Nota Keluaran
Fixed color plot issues (color selection now outside of plot)Nota Keluaran
Added candle colors for when close is more than X standard deviations of the distance between close & the moving average, away from the moving averageAdded candle colors for when OHLC is more than X standard deviations of the distance between close & the moving average, away from the moving average
Nota Keluaran
- Changed default settings to 20 period SMA- Added plot shapes to indicator whether price distance is above/below standard deviation
Chart on left shows indicator in separate pane. Chart on right shows indicator overlaying price, with all but shapes hidden. Latter can be handy for quick information.
Skrip sumber terbuka
Dalam semangat TradingView sebenar, pencipta skrip ini telah menjadikannya sumber terbuka, jadi pedagang boleh menilai dan mengesahkan kefungsiannya. Terima kasih kepada penulis! Walaupuan anda boleh menggunakan secara percuma, ingat bahawa penerbitan semula kod ini tertakluk kepada Peraturan Dalaman.
Penafian
Maklumat dan penerbitan adalah tidak bertujuan, dan tidak membentuk, nasihat atau cadangan kewangan, pelaburan, dagangan atau jenis lain yang diberikan atau disahkan oleh TradingView. Baca lebih dalam Terma Penggunaan.