PROTECTED SOURCE SCRIPT
HTF Candles and Regression Channel [100Zabaan]
🟢🟢 HTF Candles and Regression Channel 🟢🟢
🟡 Overview
This is a powerful multi-timeframe analysis tool designed to help traders understand the overall market context and structure at a glance. It provides a comprehensive view of the price trend across multiple timeframes, from long-term (weekly) to short-term (one-minute), all simultaneously on a single chart.
This tool assists your market analysis in two primary ways:
🟡 Key Features
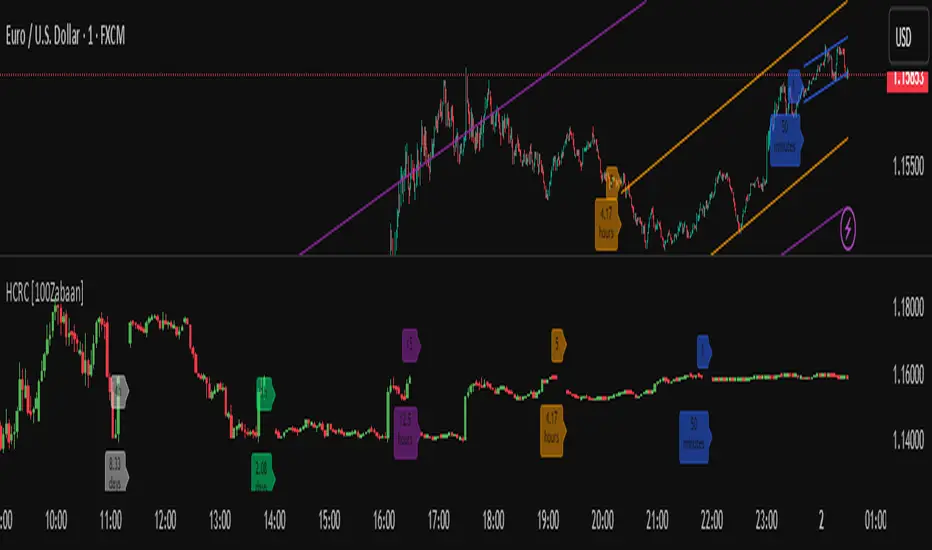
1. Multi-Timeframe Candle Viewer
In a separate pane below the main chart, this indicator displays the last N candles (adjustable number) from various timeframes (Weekly, Daily, 4-Hour, etc.).
This feature allows you to easily compare the trend strength and volatility across different timeframes and assess the current price position within the context of larger trends.
For instance, if you set the number of candles to 50, you can simultaneously monitor the last 50 candles from various timeframes like weekly, daily, 4-hour, 1-hour, 15-minute, 5-minute, and 1-minute, all within a dedicated pane.
Additionally, descriptive labels guide you, indicating the time period covered by each timeframe's set of candles.
Robust and Optimized Data-Fetching Mechanism: To render the candles, the indicator uses box and line objects and fetches data from multiple timeframes. The data-fetching engine has been specifically designed for high stability and performance. This allows you to reliably view a large number of candles from high timeframes (e.g., 60 weekly candles) even while on a very low timeframe like the one-minute chart, without encountering common historical data loading errors.

2. Automatic Linear Regression Channels
The indicator automatically plots linear regression channels for various time periods directly on your main price chart. This allows you to examine the price trend's path across different timeframes.
For better readability, the labels and their corresponding regression channels for each timeframe are color-coordinated.
Key Difference: Unlike standard tools that often focus on the closing price “Close”, this indicator uses the average price of a candle “OHLC4” to calculate the central regression line. The advantage of this approach is a more balanced and stable representation of the trend, which is less affected by sharp price fluctuations within a single candle.
Furthermore, the upper and lower channel boundaries are drawn based on a fraction of the period's maximum volatility, rather than the standard deviation, leading to a channel that adapts more effectively to the actual price action.
🟡How to Use & Input Settings
🟡 Important Notes & Limitations
🔴Disclaimer
This indicator is provided for educational, informational, and analytical purposes only and should not be considered as financial advice or a definitive signal for buying or selling. Past performance is not indicative of future results. All investment and trading activities involve risk, and the user is solely responsible for any profits or losses. Please conduct your own research and consult with a qualified financial advisor before making any financial decisions.
🔴 Developers: Mr. Mohammad sanaei
⭐️⭐️ Feel free to share your feedback in the comments ⭐️⭐️
این اندیکاتور یک ابزار تحلیلی چند-زمانی قدرتمند است که به معاملهگران کمک میکند تا با یک نگاه، زمینه و ساختار کلی بازار را درک کرده و دیدی جامعی از روند قیمت و تایمفریمهای بلندمدت (هفتگی) تا کوتاهمدت (یک دقیقه)، به طور همزمان روی یک نمودار به دست آورند.
این ابزار از دو طریق به شما در تحلیل بازار کمک میکند:
🔴 توسعه دهندگان: محمد ثنائی
⭐️⭐️ لطفاً نظرات خود را در کامنتها با ما در میان بگذارید; از خواندن بازخوردهای شما خوشحال میشویم. ⭐️⭐️
🟡 Overview
This is a powerful multi-timeframe analysis tool designed to help traders understand the overall market context and structure at a glance. It provides a comprehensive view of the price trend across multiple timeframes, from long-term (weekly) to short-term (one-minute), all simultaneously on a single chart.
This tool assists your market analysis in two primary ways:
- Displaying recent candles from higher timeframes to quickly grasp the strength, momentum, and overall trend context on different scales.
- Displaying automatic linear regression channels to visually identify the direction, slope, and strength of the trend in your selected time periods.
🟡 Key Features
1. Multi-Timeframe Candle Viewer
In a separate pane below the main chart, this indicator displays the last N candles (adjustable number) from various timeframes (Weekly, Daily, 4-Hour, etc.).
This feature allows you to easily compare the trend strength and volatility across different timeframes and assess the current price position within the context of larger trends.
For instance, if you set the number of candles to 50, you can simultaneously monitor the last 50 candles from various timeframes like weekly, daily, 4-hour, 1-hour, 15-minute, 5-minute, and 1-minute, all within a dedicated pane.
Additionally, descriptive labels guide you, indicating the time period covered by each timeframe's set of candles.
Robust and Optimized Data-Fetching Mechanism: To render the candles, the indicator uses box and line objects and fetches data from multiple timeframes. The data-fetching engine has been specifically designed for high stability and performance. This allows you to reliably view a large number of candles from high timeframes (e.g., 60 weekly candles) even while on a very low timeframe like the one-minute chart, without encountering common historical data loading errors.
2. Automatic Linear Regression Channels
The indicator automatically plots linear regression channels for various time periods directly on your main price chart. This allows you to examine the price trend's path across different timeframes.
For better readability, the labels and their corresponding regression channels for each timeframe are color-coordinated.
Key Difference: Unlike standard tools that often focus on the closing price “Close”, this indicator uses the average price of a candle “OHLC4” to calculate the central regression line. The advantage of this approach is a more balanced and stable representation of the trend, which is less affected by sharp price fluctuations within a single candle.
Furthermore, the upper and lower channel boundaries are drawn based on a fraction of the period's maximum volatility, rather than the standard deviation, leading to a channel that adapts more effectively to the actual price action.
🟡How to Use & Input Settings
- Add the indicator to your chart
- Go to the indicator's settings
- In the Inputs tab, adjust the values according to your strategy:
Number of Candles to Display: Specify the number of recent candles to show in the bottom pane.
Show Time Period Labels: Toggle the visibility of labels that show the time span covered by each timeframe.
Show Regression Channels: Toggle the visibility of the regression channels on the main chart.
Timeframe Selection: Choose which timeframes you want to be displayed.
Style Settings: Configure the color and thickness of the regression lines to match their labels.
🟡 Important Notes & Limitations
- No Repainting: This indicator is designed to be non-repainting. The values displayed are fixed once a candle closes. (Note: The values on the current, real-time candle will update until it closes).
- Compatibility: This indicator is compatible with all symbols but is designed for optimal performance on timeframes lower than Daily.
- Chart Timeframe Dependency: The indicator automatically hides timeframes in the bottom pane that are smaller than your current chart's timeframe. To view all possible resolutions, set your chart to the 1-minute timeframe.
- Time Period Display Precision: The labels indicating the time duration (e.g., "1.2 years") may show approximate values due to rounding and are not intended to be perfectly precise.
- Note Regarding the Source Code: The core logic of this indicator, especially the proprietary formulas used, is the result of personal research and development. To preserve this unique methodology and ensure its integrity for future developments, this version is released as closed-source. However, we have made every effort to fully and transparently describe the indicator's logic and operational process in the explanations.
🔴Disclaimer
This indicator is provided for educational, informational, and analytical purposes only and should not be considered as financial advice or a definitive signal for buying or selling. Past performance is not indicative of future results. All investment and trading activities involve risk, and the user is solely responsible for any profits or losses. Please conduct your own research and consult with a qualified financial advisor before making any financial decisions.
🔴 Developers: Mr. Mohammad sanaei
⭐️⭐️ Feel free to share your feedback in the comments ⭐️⭐️
این اندیکاتور یک ابزار تحلیلی چند-زمانی قدرتمند است که به معاملهگران کمک میکند تا با یک نگاه، زمینه و ساختار کلی بازار را درک کرده و دیدی جامعی از روند قیمت و تایمفریمهای بلندمدت (هفتگی) تا کوتاهمدت (یک دقیقه)، به طور همزمان روی یک نمودار به دست آورند.
این ابزار از دو طریق به شما در تحلیل بازار کمک میکند:
- نمایش کندلهای اخیر تایمفریمهای بالاتر برای درک سریع قدرت، مومنتوم و بررسی کلی روند در مقیاسهای مختلف.
- نمایش کانال رگرسیون خطی خودکار برای تشخیص بصری جهت، شیب و قدرت روند در بازههای زمانی منتخب شما.
🔴 توسعه دهندگان: محمد ثنائی
⭐️⭐️ لطفاً نظرات خود را در کامنتها با ما در میان بگذارید; از خواندن بازخوردهای شما خوشحال میشویم. ⭐️⭐️
Skrip dilindungi
Skrip ini diterbitkan sebagai sumber tertutup. Akan tetapi, anda boleh menggunakannya secara bebas dan tanpa apa-apa had – ketahui lebih di sini.
Penafian
Maklumat dan penerbitan adalah tidak bertujuan, dan tidak membentuk, nasihat atau cadangan kewangan, pelaburan, dagangan atau jenis lain yang diberikan atau disahkan oleh TradingView. Baca lebih dalam Terma Penggunaan.