OPEN-SOURCE SCRIPT
Volume Peak Box
TH Description
Volume Peak Box
อินดิเคเตอร์นี้ใช้ตรวจจับช่วงที่มี Volume สูงผิดปกติ โดยใช้ Bollinger Band กับข้อมูล Volume ที่ดึงจาก Timeframe ที่ล็อกไว้ (เช่น 1 ชั่วโมง) และจะแสดงผลในรูปแบบ กล่องครอบช่วงราคาสูง–ต่ำ ของช่วง Volume Peak นั้น
🔧 วิธีทำงาน:
คำนวณ Bollinger Band จาก Volume ของ Timeframe ที่กำหนด
ถ้า Volume สูงกว่า Upper Band → ถือว่าเป็น Volume Peak
วาดกล่องครอบ High–Low ของแท่งที่อยู่ในช่วง Volume Peak
กล่องจะแสดงบนทุก Timeframe แต่ใช้ข้อมูลจาก Timeframe ที่ล็อกไว้เท่านั้น
🧠 เหมาะสำหรับการดู:
โซน Breakout
การเคลื่อนไหวของสถาบัน
ความไม่สมดุลของอุปสงค์/อุปทาน
เหมาะมากหากใช้ร่วมกับการอ่านพฤติกรรมราคาใน Timeframe ย่อย เพื่อดูปฏิกิริยาราคาต่อแรง Volume จาก Timeframe ใหญ่
________________
ENG Description
Volume Peak Box
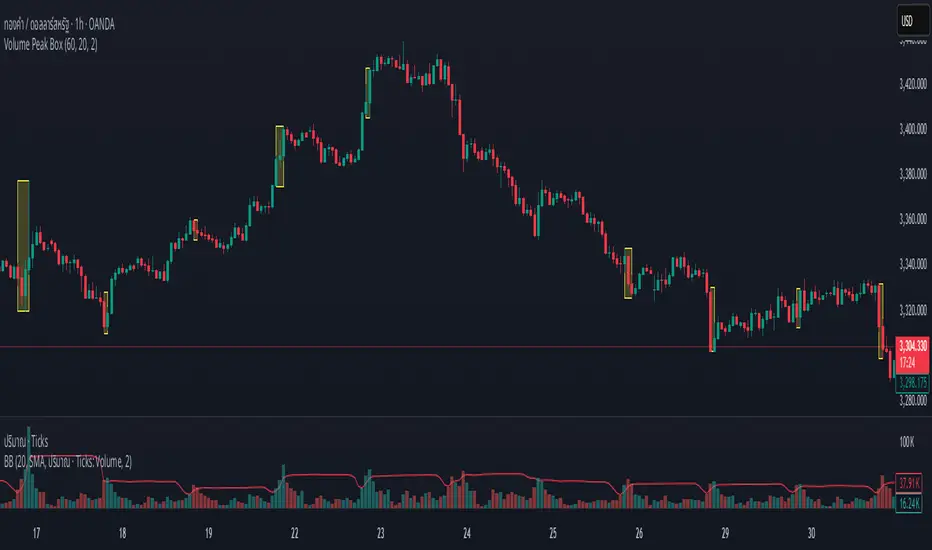
This indicator detects volume spikes based on Bollinger Bands applied to volume from a locked timeframe (e.g. 1H), and draws a box around the price range during those peak periods.
🔧 How it works:
Calculates Bollinger Bands on volume from the selected timeframe.
If volume exceeds the upper band, it is marked as a volume peak.
When a volume peak starts and ends, the indicator draws a box covering the high–low price range during that period.
These boxes remain visible on all timeframes, but always reflect data from the locked timeframe.
🧠 Great for identifying:
Breakout zones
Institutional activity
Supply/demand imbalances
Tip: Use with lower timeframe price action to see how the market reacts near volume peaks from higher timeframes.
Volume Peak Box
อินดิเคเตอร์นี้ใช้ตรวจจับช่วงที่มี Volume สูงผิดปกติ โดยใช้ Bollinger Band กับข้อมูล Volume ที่ดึงจาก Timeframe ที่ล็อกไว้ (เช่น 1 ชั่วโมง) และจะแสดงผลในรูปแบบ กล่องครอบช่วงราคาสูง–ต่ำ ของช่วง Volume Peak นั้น
🔧 วิธีทำงาน:
คำนวณ Bollinger Band จาก Volume ของ Timeframe ที่กำหนด
ถ้า Volume สูงกว่า Upper Band → ถือว่าเป็น Volume Peak
วาดกล่องครอบ High–Low ของแท่งที่อยู่ในช่วง Volume Peak
กล่องจะแสดงบนทุก Timeframe แต่ใช้ข้อมูลจาก Timeframe ที่ล็อกไว้เท่านั้น
🧠 เหมาะสำหรับการดู:
โซน Breakout
การเคลื่อนไหวของสถาบัน
ความไม่สมดุลของอุปสงค์/อุปทาน
เหมาะมากหากใช้ร่วมกับการอ่านพฤติกรรมราคาใน Timeframe ย่อย เพื่อดูปฏิกิริยาราคาต่อแรง Volume จาก Timeframe ใหญ่
________________
ENG Description
Volume Peak Box
This indicator detects volume spikes based on Bollinger Bands applied to volume from a locked timeframe (e.g. 1H), and draws a box around the price range during those peak periods.
🔧 How it works:
Calculates Bollinger Bands on volume from the selected timeframe.
If volume exceeds the upper band, it is marked as a volume peak.
When a volume peak starts and ends, the indicator draws a box covering the high–low price range during that period.
These boxes remain visible on all timeframes, but always reflect data from the locked timeframe.
🧠 Great for identifying:
Breakout zones
Institutional activity
Supply/demand imbalances
Tip: Use with lower timeframe price action to see how the market reacts near volume peaks from higher timeframes.
Skrip sumber terbuka
Dalam semangat sebenar TradingView, pencipta skrip ini telah menjadikannya sumber terbuka supaya pedagang dapat menilai dan mengesahkan kefungsiannya. Terima kasih kepada penulis! Walaupun anda boleh menggunakannya secara percuma, ingat bahawa menerbitkan semula kod ini adalah tertakluk kepada Peraturan Dalaman kami.
Penafian
Maklumat dan penerbitan adalah tidak dimaksudkan untuk menjadi, dan tidak membentuk, nasihat untuk kewangan, pelaburan, perdagangan dan jenis-jenis lain atau cadangan yang dibekalkan atau disahkan oleh TradingView. Baca dengan lebih lanjut di Terma Penggunaan.