PROTECTED SOURCE SCRIPT
Telah dikemas kini EMA Trio + Dashboard (21/65/225) — Alagha
EMA Trio + Dashboard (21/65/225)
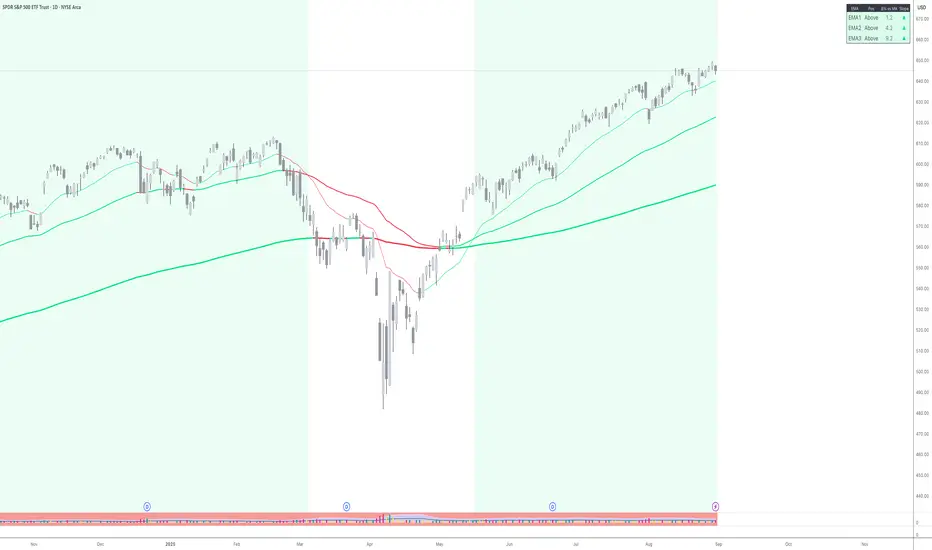
A clean, professional tool for reading trend structure at a glance. It plots three exponential moving averages (default 21 / 65 / 225) with progressively thicker lines and slope-based coloring, adds a compact top-right dashboard (position vs. each EMA, % distance, slope), and ships with descriptive alerts for price crossing above/below each EMA. Optional trend-stack background, ATR stretch signals, and higher-timeframe confluence round it out for swing and position traders.
What it does
Three EMAs (configurable) — default 21/65/225; thinner → thicker as periods increase for instant visual hierarchy.
Slope coloring — green/red/flat based on EMA slope (or optionally close vs. prior close).
Top-right dashboard — shows Above/Below/At, Δ% vs EMA, and slope arrows (▲/▼/■) for all three MAs.
Smart alerts
Server-side alert conditions when price crosses above/below each EMA (1/2/3).
Optional rich alert() messages including symbol, timeframe, direction, price, EMA value, and % distance.
Trend filter (stacking) — subtle background tint when EMA21 > EMA65 > EMA225 (bull) or the reverse (bear).
Stretch detector — flags when price is > / < EMA21 ± ATR × multiple to highlight potential pullback/mean-reversion zones.
HTF confluence (optional) — overlay EMA#1 from a higher timeframe (e.g., 4H on a 1H chart).
How to use it (quick)
Read the stack & slope: Rising, green 21 above 65 above 225 = strong tailwind; the opposite = headwind.
Entries: In stacked trends, look for controlled pullbacks toward a rising 21 EMA; avoid chases when ATR-stretch is triggered.
Alerts:
Create server-side alerts from the indicator’s “crossed ABOVE/BELOW EMA #” conditions.
Or set one alert on “Any alert() function call” for rich, dynamic messages.
Toggle “Only alert after bar closes” if you prefer confirmed signals.
Inputs you control
Lengths/visibility for each EMA, base line width, colors, transparency, slope-coloring mode.
Dashboard decimals.
Extras: enable stacked-trend background, set ATR length & stretch multiple, turn on HTF EMA and choose timeframe.
Nota Keluaran
EMA Trio + Dashboard (21/65/225)A clean, professional tool for reading trend structure at a glance. It plots three exponential moving averages (default 21 / 65 / 225) with progressively thicker lines and slope-based coloring, adds a compact top-right dashboard (position vs. each EMA, % distance, slope), and ships with descriptive alerts for price crossing above/below each EMA. Optional trend-stack background, ATR stretch signals, and higher-timeframe confluence round it out for swing and position traders.
What it does
- Three EMAs (configurable) — default 21/65/225; thinner → thicker as periods increase for instant visual hierarchy.
- Slope coloring — green/red/flat based on EMA slope (or optionally close vs. prior close).
- Top-right dashboard — shows Above/Below/At, Δ% vs EMA, and slope arrows (▲/▼/■) for all three MAs.
- Smart alerts
- Server-side alert conditions when price crosses above/below each EMA (1/2/3).
- Optional rich alert() messages including symbol, timeframe, direction, price, EMA value, and % distance.
- Trend filter (stacking) — subtle background tint when EMA21 > EMA65 > EMA225 (bull) or the reverse (bear).
- Stretch detector — flags when price is > / < EMA21 ± ATR × multiple to highlight potential pullback/mean-reversion zones.
- HTF confluence (optional) — overlay EMA#1 from a higher timeframe (e.g., 4H on a 1H chart).
How to use it (quick)
- Read the stack & slope: Rising, green 21 above 65 above 225 = strong tailwind; the opposite = headwind.
- Entries: In stacked trends, look for controlled pullbacks toward a rising 21 EMA; avoid chases when ATR-stretch is triggered.
- Alerts:
- Create server-side alerts from the indicator’s “crossed ABOVE/BELOW EMA #” conditions.
- Or set one alert on “Any alert() function call” for rich, dynamic messages.
- Toggle “Only alert after bar closes” if you prefer confirmed signals.
Inputs you control
- Lengths/visibility for each EMA, base line width, colors, transparency, slope-coloring mode.
- Dashboard decimals.
- Extras: enable stacked-trend background, set ATR length & stretch multiple, turn on HTF EMA and choose timeframe.
Nota Keluaran
EMA Trio + Dashboard (EMA 21/65/225)A clean, professional tool for reading trend structure at a glance. It plots three exponential moving averages (default 21 / 65 / 225) with progressively thicker lines and slope-based coloring, adds a compact top-right dashboard (position vs. each EMA, % distance, slope), and ships with descriptive alerts for price crossing above/below each EMA. Optional trend-stack background, ATR stretch signals, and higher-timeframe confluence round it out for swing and position traders.
What it does
- Three EMAs (configurable) — default 21/65/225; thinner → thicker as periods increase for instant visual hierarchy.
- Slope coloring — green/red/flat based on EMA slope (or optionally close vs. prior close).
- Top-right dashboard — shows Above/Below/At, Δ% vs EMA, and slope arrows (▲/▼/■) for all three MAs.
- Smart alerts
- Server-side alert conditions when price crosses above/below each EMA (1/2/3).
- Optional rich alert() messages including symbol, timeframe, direction, price, EMA value, and % distance.
- Trend filter (stacking) — subtle background tint when EMA21 > EMA65 > EMA225 (bull) or the reverse (bear).
- Stretch detector — flags when price is > / < EMA21 ± ATR × multiple to highlight potential pullback/mean-reversion zones.
- HTF confluence (optional) — overlay EMA#1 from a higher timeframe (e.g., 4H on a 1H chart).
- How to use it (quick)
- Read the stack & slope: Rising, green 21 above 65 above 225 = strong tailwind; the opposite = headwind.
- Entries: In stacked trends, look for controlled pullbacks toward a rising 21 EMA; avoid chases when ATR-stretch is triggered.
Alerts:
- Create server-side alerts from the indicator’s “crossed ABOVE/BELOW EMA #” conditions.
- Or set one alert on “Any alert() function call” for rich, dynamic messages.
- Toggle “Only alert after bar closes” if you prefer confirmed signals.
Inputs you control
Lengths/visibility for each EMA, base line width, colors, transparency, slope-coloring mode.
Dashboard decimals.
Extras: enable stacked-trend background, set ATR length & stretch multiple, turn on HTF EMA and choose timeframe.
Skrip dilindungi
Skrip ini diterbitkan sebagai sumber tertutup. Akan tetapi, anda boleh menggunakannya dengan percuma dan tanpa had – ketahui lebih lanjut di sini.
Penafian
Maklumat dan penerbitan adalah tidak dimaksudkan untuk menjadi, dan tidak membentuk, nasihat untuk kewangan, pelaburan, perdagangan dan jenis-jenis lain atau cadangan yang dibekalkan atau disahkan oleh TradingView. Baca dengan lebih lanjut di Terma Penggunaan.