OPEN-SOURCE SCRIPT
ATR Clouds
*Updated with Version 5*
ATR Clouds
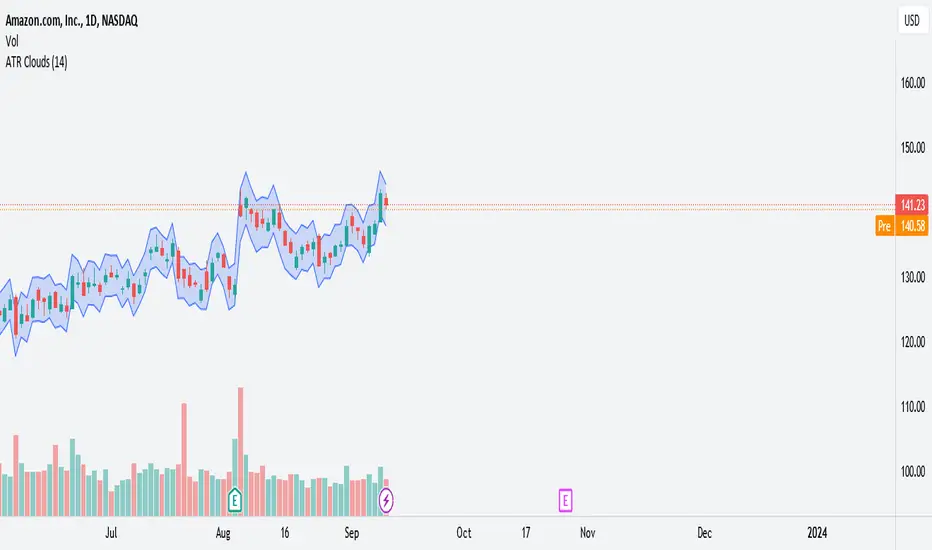
The "ATR Clouds" indicator provides a visual representation of the stock's volatility based on the Average True Range (ATR) calculation. It operates by plotting two bands around the closing price of a stock, using the ATR as a measure of volatility.
Features:
ATR Calculation: The Average True Range is a commonly used metric to understand the volatility of an asset. The indicator calculates the ATR over a user-defined period, with the default being 14 periods.
ATR Bands: Using the ATR value, the script defines two bands:
Upper Band: This is calculated by adding the ATR value to the closing price of the stock. It represents a higher volatility boundary.
Lower Band: This is derived by subtracting the ATR value from the closing price. It indicates a lower volatility boundary.
Cloud Visualization: The space between the upper and lower bands is shaded to create a "cloud" on the chart. This cloud gives traders a clear visual cue of the stock's current volatility range. The cloud has an 80% transparency, allowing the underlying price chart to remain visible.
Customization: Users have the ability to adjust the period for the ATR calculation based on their preferences.
Usage:
Traders can use the ATR Clouds indicator to get a sense of the stock's volatility. Wider clouds indicate periods of higher volatility, while narrower clouds suggest lower volatility. This can be beneficial for se
ATR Clouds
The "ATR Clouds" indicator provides a visual representation of the stock's volatility based on the Average True Range (ATR) calculation. It operates by plotting two bands around the closing price of a stock, using the ATR as a measure of volatility.
Features:
ATR Calculation: The Average True Range is a commonly used metric to understand the volatility of an asset. The indicator calculates the ATR over a user-defined period, with the default being 14 periods.
ATR Bands: Using the ATR value, the script defines two bands:
Upper Band: This is calculated by adding the ATR value to the closing price of the stock. It represents a higher volatility boundary.
Lower Band: This is derived by subtracting the ATR value from the closing price. It indicates a lower volatility boundary.
Cloud Visualization: The space between the upper and lower bands is shaded to create a "cloud" on the chart. This cloud gives traders a clear visual cue of the stock's current volatility range. The cloud has an 80% transparency, allowing the underlying price chart to remain visible.
Customization: Users have the ability to adjust the period for the ATR calculation based on their preferences.
Usage:
Traders can use the ATR Clouds indicator to get a sense of the stock's volatility. Wider clouds indicate periods of higher volatility, while narrower clouds suggest lower volatility. This can be beneficial for se
Skrip sumber terbuka
Dalam semangat TradingView sebenar, pencipta skrip ini telah menjadikannya sumber terbuka, jadi pedagang boleh menilai dan mengesahkan kefungsiannya. Terima kasih kepada penulis! Walaupuan anda boleh menggunakan secara percuma, ingat bahawa penerbitan semula kod ini tertakluk kepada Peraturan Dalaman.
Penafian
Maklumat dan penerbitan adalah tidak bertujuan, dan tidak membentuk, nasihat atau cadangan kewangan, pelaburan, dagangan atau jenis lain yang diberikan atau disahkan oleh TradingView. Baca lebih dalam Terma Penggunaan.