OPEN-SOURCE SCRIPT
Untouched Extremes
What it is
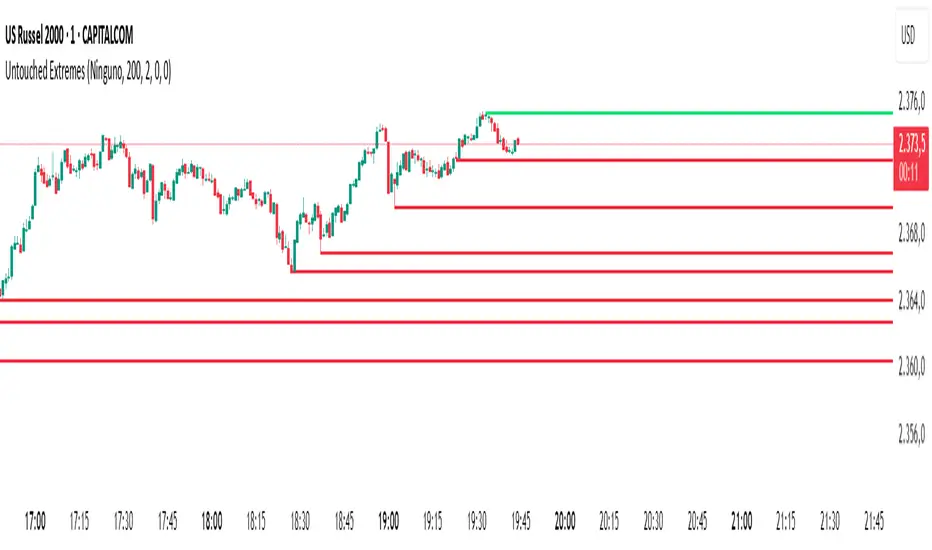
Untouched Extremes plots horizontal levels at green-candle highs and red-candle lows. Each level is considered “untouched” (clean liquidity) until price revisits it; on the first valid touch the line auto-deletes, keeping only live targets on your chart.
How it works (logic)
Bar close event
If close > open, the script draws a line at that bar’s high and extends it to the right.
If close < open, it draws a line at that bar’s low and extends it to the right.
(Optional) Perfect/almost-dojis can be classified as green or red via settings.
Touch & removal
A green-high line is removed when any later bar’s high ≥ level (optionally within a tick tolerance).
A red-low line is removed when any later bar’s low ≤ level (optionally within a tick tolerance).
You can delay deletion by N bars to make the touch visible before the line disappears.
Housekeeping
Maximum active lines per side and line styling are user-configurable.
Why it’s useful
Untouched highs/lows often coincide with resting liquidity and incomplete price probes. Tracking them helps:
Define targets and magnets price may seek.
Frame mean-reversion rotations after a failed push.
Keep the chart clean: only levels that have not been traded are displayed.
How to use it (trading idea)
Confirmation rule: Treat the line as a level/zone. Price can pierce it; wait for a clear reversal candle pattern (e.g., pin bar, engulfing, strong momentum shift) at or immediately after the touch.
Directional play:
If a bullish reversal pattern forms at/around a red-low line, the working assumption is that price will move toward the first untouched upper line (nearest green-high line above). Many traders use that as the primary target.
Conversely, if a bearish reversal pattern forms at/around a green-high line, expect rotation toward the first untouched lower line.
Risk management: Stops typically go just beyond the level or beyond the pattern’s wick. Consider a fixed R:R (e.g., 1:2) and partials at intermediate levels.
Settings
Doji handling: Choose how to classify close ≈ open bars (Green / Red / Ignore). A small equality margin (ticks) helps with rounding on some symbols.
Touch tolerance (ticks): Counts near-misses as touches if desired.
Deletion delay (bars): Wait N bars after creation before a line becomes eligible for deletion.
Max lines per side / width / colors: Keep the view readable.
Tips
Works on any symbol/timeframe; lower TFs produce more levels—adjust Max lines accordingly.
Combining with a trend filter (e.g., EMA-200), ATR distance, or volume clues can improve selectivity.
If spreads or wicks are noisy, increase tolerance slightly and/or use deletion delay to visualize touches.
Note: This tool provides structure and potential targets, not signals by itself. Always require your reversal pattern as confirmation and manage risk appropriately.
Skrip sumber terbuka
Dalam semangat TradingView sebenar, pencipta skrip ini telah menjadikannya sumber terbuka, jadi pedagang boleh menilai dan mengesahkan kefungsiannya. Terima kasih kepada penulis! Walaupuan anda boleh menggunakan secara percuma, ingat bahawa penerbitan semula kod ini tertakluk kepada Peraturan Dalaman.
Penafian
Maklumat dan penerbitan adalah tidak bertujuan, dan tidak membentuk, nasihat atau cadangan kewangan, pelaburan, dagangan atau jenis lain yang diberikan atau disahkan oleh TradingView. Baca lebih dalam Terma Penggunaan.