OPEN-SOURCE SCRIPT
Sine Wave
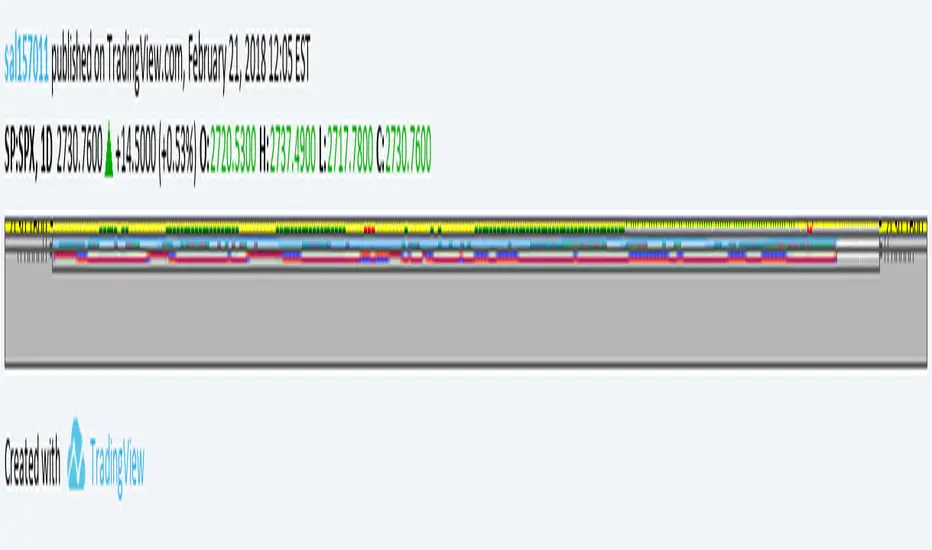
This is John F. Ehlers, Hilbert Sine Wave with barcolor and bgcolor.
When fast line red crosses down slow line blue that is a zone of resistance in the price chart, and when fast line crosses up slow line blue that is a zone of support.
When close of the bar is equal or greater than the zone of resistance there is a trend up mode in place and trending instruments like Hull moving average should be used, and when the close of the bar is equal or greater than the zone of resistance there is a trend down in place and trending instruments should be used too.
When none of the preceeding conditions are valid there is a cycle mode, and cycle instruments like oscillators, stochastics and the Sine Wave itself should be used. Note that the Sine Wave is almost always a leading indicator when in a cycle mode.
Barcolor and bgcolor mean: Green = Trend Up , Red = Trend Down, Yellow= Cycle mode
Skrip sumber terbuka
Dalam semangat TradingView sebenar, pencipta skrip ini telah menjadikannya sumber terbuka, jadi pedagang boleh menilai dan mengesahkan kefungsiannya. Terima kasih kepada penulis! Walaupuan anda boleh menggunakan secara percuma, ingat bahawa penerbitan semula kod ini tertakluk kepada Peraturan Dalaman.
Penafian
Maklumat dan penerbitan adalah tidak bertujuan, dan tidak membentuk, nasihat atau cadangan kewangan, pelaburan, dagangan atau jenis lain yang diberikan atau disahkan oleh TradingView. Baca lebih dalam Terma Penggunaan.