OPEN-SOURCE SCRIPT
Telah dikemas kini MA Crossover with Adaptive Trend Strength
📘 MA Crossover with Adaptive Trend Strength —
📌 Overview
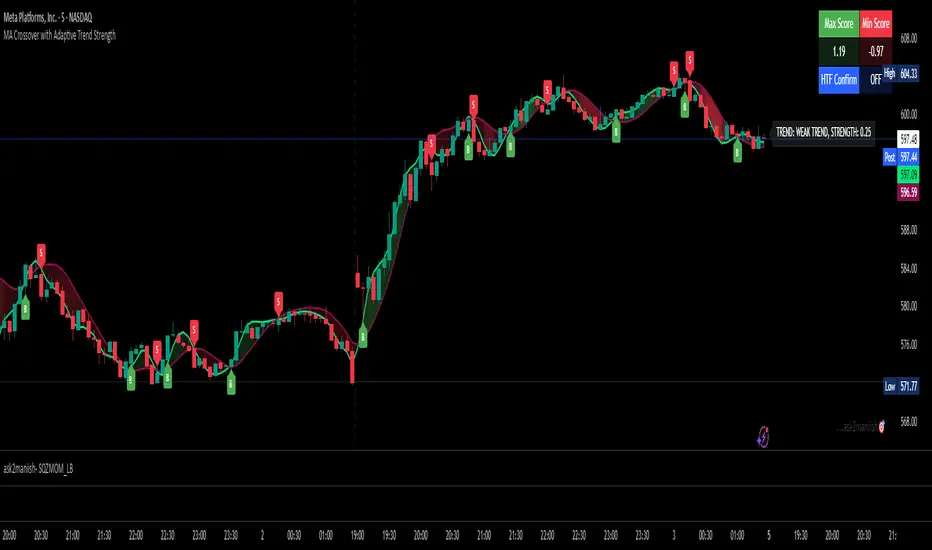
This TradingView indicator plots two moving averages (Fast & Slow) with user-selected types (T3, EMA, SMA, HMA), visual crossovers, and dynamically calculates an adaptive trend strength score using Z-scores of multiple features. Optional higher timeframe (HTF) confirmation is supported. A color-filled region between the MAs visually indicates momentum direction.
⚙️ Inputs & Controls
📈 Moving Average Settings
Fast MA Length: Length of the fast-moving average (default: 9).
Slow MA Length: Length of the slow-moving average (default: 21).
MA Type: Type of moving average used (T3, EMA, SMA, HMA).
Source: Input data source (default: close).
T3 Volume Factor: Only used when T3 is selected, controls smoothing (range: 0–1).
🎨 Visual Controls
Bullish Fill Color: Fill color when Fast MA is above Slow MA.
Bearish Fill Color: Fill color when Fast MA is below Slow MA.
Show Gradient Fill: Enable or disable the colored area between Fast & Slow MAs.
Trend Label Position: Choose where the trend strength label appears (top or bottom).
Label Update Interval: Number of bars between label updates (reduces clutter).
⏱ Multi-Timeframe Support
Higher Timeframe: Timeframe used for confirmation (default: 60 min).
Use HTF Confirmation: Enables filtering of trend score by higher timeframe trend direction.
📊 Lookback Configuration
Auto Lookback Based on Timeframe: Dynamically adapts scoring lookback period per chart timeframe.
Manual Lookback: Manual fallback lookback length when auto is off.
🧮 MA Calculation Options
T3 MA: Custom T3 function with exponential moving averages and volume factor.
EMA/SMA: Built-in Pine functions (ta.ema, ta.sma).
HMA: Hull Moving Average using WMA calculations.
📉 Trend Strength Calculation
🧠 Z-Score Inputs
Distance between MAs (zDist)
Slope of the Fast MA (zSlope)
Volume (zVol)
ATR (zATR)
📏 Choppiness & Adaptive Weighting
A Choppiness Index (based on ATR & price range) reduces score impact in sideways markets.
Dynamically adjusts Z-score weights:
W1: Distance
W2: Slope
W3: Volume
W4: ATR
🔁 HTF Confirmation
Optionally multiplies the trend score by the direction of the higher timeframe trend to filter noise.
🟩 Plot & Visual Elements
📊 MA Lines
Plots Fast and Slow MA lines in colors based on selected MA type.
🌈 Gradient Fill
Fills the area between Fast and Slow MAs with opacity proportional to their difference.
Colors based on bullish/bearish condition.
🏷️ Trend Strength Label
Updates every n bars (Label Update Interval).
Shows:
Trend Classification: Weak, Moderate, Strong
Numerical Score
Label position (top or bottom) is configurable.
🔔 Crossover Signals
Bullish Crossover ("B"): Fast MA crosses above Slow MA.
Bearish Crossover ("S"): Fast MA crosses below Slow MA.
Labels are plotted at crossover points.
Old labels are removed after a threshold (100) to reduce chart clutter.
📋 Score Summary Table
A table showing:
Max Score within the lookback period
Min Score
HTF Confirmation Status (ON / OFF)
Updates on the same user-defined interval as the trend label.
🚨 Alerts
Condition Description
Bullish MA Cross Fast MA crosses above Slow MA
Bearish MA Cross Fast MA crosses below Slow MA
These are provided via alertcondition() for use in alert creation.
📌 Customization Tips
Turn off the gradient fill for a cleaner chart.
Use HTF confirmation to reduce false positives in ranging markets.
Adjust label update frequency to prevent visual clutter on faster timeframes.
Use T3 MA with volume factor for smoother signals in volatile markets.
📌 Overview
This TradingView indicator plots two moving averages (Fast & Slow) with user-selected types (T3, EMA, SMA, HMA), visual crossovers, and dynamically calculates an adaptive trend strength score using Z-scores of multiple features. Optional higher timeframe (HTF) confirmation is supported. A color-filled region between the MAs visually indicates momentum direction.
⚙️ Inputs & Controls
📈 Moving Average Settings
Fast MA Length: Length of the fast-moving average (default: 9).
Slow MA Length: Length of the slow-moving average (default: 21).
MA Type: Type of moving average used (T3, EMA, SMA, HMA).
Source: Input data source (default: close).
T3 Volume Factor: Only used when T3 is selected, controls smoothing (range: 0–1).
🎨 Visual Controls
Bullish Fill Color: Fill color when Fast MA is above Slow MA.
Bearish Fill Color: Fill color when Fast MA is below Slow MA.
Show Gradient Fill: Enable or disable the colored area between Fast & Slow MAs.
Trend Label Position: Choose where the trend strength label appears (top or bottom).
Label Update Interval: Number of bars between label updates (reduces clutter).
⏱ Multi-Timeframe Support
Higher Timeframe: Timeframe used for confirmation (default: 60 min).
Use HTF Confirmation: Enables filtering of trend score by higher timeframe trend direction.
📊 Lookback Configuration
Auto Lookback Based on Timeframe: Dynamically adapts scoring lookback period per chart timeframe.
Manual Lookback: Manual fallback lookback length when auto is off.
🧮 MA Calculation Options
T3 MA: Custom T3 function with exponential moving averages and volume factor.
EMA/SMA: Built-in Pine functions (ta.ema, ta.sma).
HMA: Hull Moving Average using WMA calculations.
📉 Trend Strength Calculation
🧠 Z-Score Inputs
Distance between MAs (zDist)
Slope of the Fast MA (zSlope)
Volume (zVol)
ATR (zATR)
📏 Choppiness & Adaptive Weighting
A Choppiness Index (based on ATR & price range) reduces score impact in sideways markets.
Dynamically adjusts Z-score weights:
W1: Distance
W2: Slope
W3: Volume
W4: ATR
🔁 HTF Confirmation
Optionally multiplies the trend score by the direction of the higher timeframe trend to filter noise.
🟩 Plot & Visual Elements
📊 MA Lines
Plots Fast and Slow MA lines in colors based on selected MA type.
🌈 Gradient Fill
Fills the area between Fast and Slow MAs with opacity proportional to their difference.
Colors based on bullish/bearish condition.
🏷️ Trend Strength Label
Updates every n bars (Label Update Interval).
Shows:
Trend Classification: Weak, Moderate, Strong
Numerical Score
Label position (top or bottom) is configurable.
🔔 Crossover Signals
Bullish Crossover ("B"): Fast MA crosses above Slow MA.
Bearish Crossover ("S"): Fast MA crosses below Slow MA.
Labels are plotted at crossover points.
Old labels are removed after a threshold (100) to reduce chart clutter.
📋 Score Summary Table
A table showing:
Max Score within the lookback period
Min Score
HTF Confirmation Status (ON / OFF)
Updates on the same user-defined interval as the trend label.
🚨 Alerts
Condition Description
Bullish MA Cross Fast MA crosses above Slow MA
Bearish MA Cross Fast MA crosses below Slow MA
These are provided via alertcondition() for use in alert creation.
📌 Customization Tips
Turn off the gradient fill for a cleaner chart.
Use HTF confirmation to reduce false positives in ranging markets.
Adjust label update frequency to prevent visual clutter on faster timeframes.
Use T3 MA with volume factor for smoother signals in volatile markets.
Nota Keluaran
Minor update: Nota Keluaran
minor update:Skrip sumber terbuka
Dalam semangat TradingView sebenar, pencipta skrip ini telah menjadikannya sumber terbuka, jadi pedagang boleh menilai dan mengesahkan kefungsiannya. Terima kasih kepada penulis! Walaupuan anda boleh menggunakan secara percuma, ingat bahawa penerbitan semula kod ini tertakluk kepada Peraturan Dalaman.
Penafian
Maklumat dan penerbitan adalah tidak bertujuan, dan tidak membentuk, nasihat atau cadangan kewangan, pelaburan, dagangan atau jenis lain yang diberikan atau disahkan oleh TradingView. Baca lebih dalam Terma Penggunaan.
Skrip sumber terbuka
Dalam semangat TradingView sebenar, pencipta skrip ini telah menjadikannya sumber terbuka, jadi pedagang boleh menilai dan mengesahkan kefungsiannya. Terima kasih kepada penulis! Walaupuan anda boleh menggunakan secara percuma, ingat bahawa penerbitan semula kod ini tertakluk kepada Peraturan Dalaman.
Penafian
Maklumat dan penerbitan adalah tidak bertujuan, dan tidak membentuk, nasihat atau cadangan kewangan, pelaburan, dagangan atau jenis lain yang diberikan atau disahkan oleh TradingView. Baca lebih dalam Terma Penggunaan.