OPEN-SOURCE SCRIPT
Support Bands
Support Bands – Discount Zones for Bitcoin
⚡Overview:
-The Support Bands indicator identifies one of the most tested and respected support zones for Bitcoin using moving averages from higher timeframes.
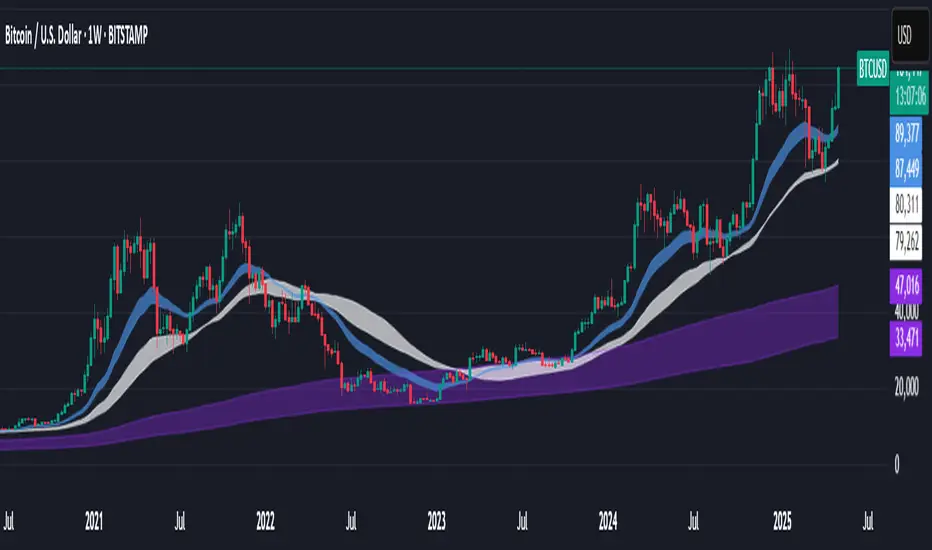
-These zones are visualized through colored bands (blue, white, and violet), simplifying the decision making process especially for less experienced traders who seek high-probability areas to accumulate Bitcoin during retracements.
-Band levels are based on manual backtesting and real-world price behavior throughout Bitcoin’s history.
-Each zone reflects a different degree of support strength, from temporary pullback zones to historical bottoms.
⚡️ Key Characteristics:
-Highlights discount zones where Bitcoin has historically shown strong reactions.
-Uses 3 different levels of supports based on EMA/SMA combinations.
-Offers a clean, non-intrusive overlay that reduces chart clutter.
⚡ How to Use:
-Open your chart on the 1W timeframe and select the BTC Bitstamp or BLX symbol, as they provide the most complete historical data, ensuring optimal performance of the indicator.
-Use the bands as reference zones for support and potential pullbacks.
- Level 3 (violet band) historically marks the bottom of Bitcoin bear markets and is ideal for long-term entries during deep corrections.
- Level 2 (white band) often signals macro reaccumulation zones but usually requires 1–3 months of consolidation before a breakout. If the price closes below and then retests this level as resistance for 1–2 weekly candles, it often marks the start of a macro downtrend.
-Level 1 (blue band) acts as short-term support during strong bullish moves, typically after a successful rebound from Level 2.
⚡ What Makes It Unique:
- This script merges moving averages per level into three simplified bands for clearer analysis.
-Reduces chart noise by avoiding multiple overlapping lines, helping you make faster and cleaner decisions.
- Built from manual market study based on recurring Bitcoin behavior, not just random code.
-Historically backtested:
-Level 3 (violet band) until today has always marked the bitcoin bearmarket bottom.
- Level 2 (white band) is the strongest support during bull markets; losing it often signals a macro trend reversal.
- Level 1 is frequently retested during impulsive rallies and can act as short-term support or resistance.
⚡ Disclaimer:
-This script is a visual tool to assist with market analysis.
-It does not generate buy or sell signals, nor does it predict future movements.
-Historical performance is not indicative of future results.
-Always use independent judgment and proper risk management.
⚡ Why Use Support Bands:
-Ideal for traders who want clarity without dozens of lines on their charts.
- Helps identify logical zones for entry or reaccumulation.
- Based on actual market behavior rather than hypothetical setups.
-If the blue band (Level 1) doesn't hold as support, the price often moves to the white band (Level 2), and if that fails too, the violet band (Level 3) is typically the last strong support. By dividing your capital into three planned entries, one at each level,you can manage risk more effectively compared to entering blindly without this structure.
⚡Overview:
-The Support Bands indicator identifies one of the most tested and respected support zones for Bitcoin using moving averages from higher timeframes.
-These zones are visualized through colored bands (blue, white, and violet), simplifying the decision making process especially for less experienced traders who seek high-probability areas to accumulate Bitcoin during retracements.
-Band levels are based on manual backtesting and real-world price behavior throughout Bitcoin’s history.
-Each zone reflects a different degree of support strength, from temporary pullback zones to historical bottoms.
⚡️ Key Characteristics:
-Highlights discount zones where Bitcoin has historically shown strong reactions.
-Uses 3 different levels of supports based on EMA/SMA combinations.
-Offers a clean, non-intrusive overlay that reduces chart clutter.
⚡ How to Use:
-Open your chart on the 1W timeframe and select the BTC Bitstamp or BLX symbol, as they provide the most complete historical data, ensuring optimal performance of the indicator.
-Use the bands as reference zones for support and potential pullbacks.
- Level 3 (violet band) historically marks the bottom of Bitcoin bear markets and is ideal for long-term entries during deep corrections.
- Level 2 (white band) often signals macro reaccumulation zones but usually requires 1–3 months of consolidation before a breakout. If the price closes below and then retests this level as resistance for 1–2 weekly candles, it often marks the start of a macro downtrend.
-Level 1 (blue band) acts as short-term support during strong bullish moves, typically after a successful rebound from Level 2.
⚡ What Makes It Unique:
- This script merges moving averages per level into three simplified bands for clearer analysis.
-Reduces chart noise by avoiding multiple overlapping lines, helping you make faster and cleaner decisions.
- Built from manual market study based on recurring Bitcoin behavior, not just random code.
-Historically backtested:
-Level 3 (violet band) until today has always marked the bitcoin bearmarket bottom.
- Level 2 (white band) is the strongest support during bull markets; losing it often signals a macro trend reversal.
- Level 1 is frequently retested during impulsive rallies and can act as short-term support or resistance.
⚡ Disclaimer:
-This script is a visual tool to assist with market analysis.
-It does not generate buy or sell signals, nor does it predict future movements.
-Historical performance is not indicative of future results.
-Always use independent judgment and proper risk management.
⚡ Why Use Support Bands:
-Ideal for traders who want clarity without dozens of lines on their charts.
- Helps identify logical zones for entry or reaccumulation.
- Based on actual market behavior rather than hypothetical setups.
-If the blue band (Level 1) doesn't hold as support, the price often moves to the white band (Level 2), and if that fails too, the violet band (Level 3) is typically the last strong support. By dividing your capital into three planned entries, one at each level,you can manage risk more effectively compared to entering blindly without this structure.
Skrip sumber terbuka
Dalam semangat TradingView sebenar, pencipta skrip ini telah menjadikannya sumber terbuka, jadi pedagang boleh menilai dan mengesahkan kefungsiannya. Terima kasih kepada penulis! Walaupuan anda boleh menggunakan secara percuma, ingat bahawa penerbitan semula kod ini tertakluk kepada Peraturan Dalaman.
Penafian
Maklumat dan penerbitan adalah tidak bertujuan, dan tidak membentuk, nasihat atau cadangan kewangan, pelaburan, dagangan atau jenis lain yang diberikan atau disahkan oleh TradingView. Baca lebih dalam Terma Penggunaan.