PROTECTED SOURCE SCRIPT
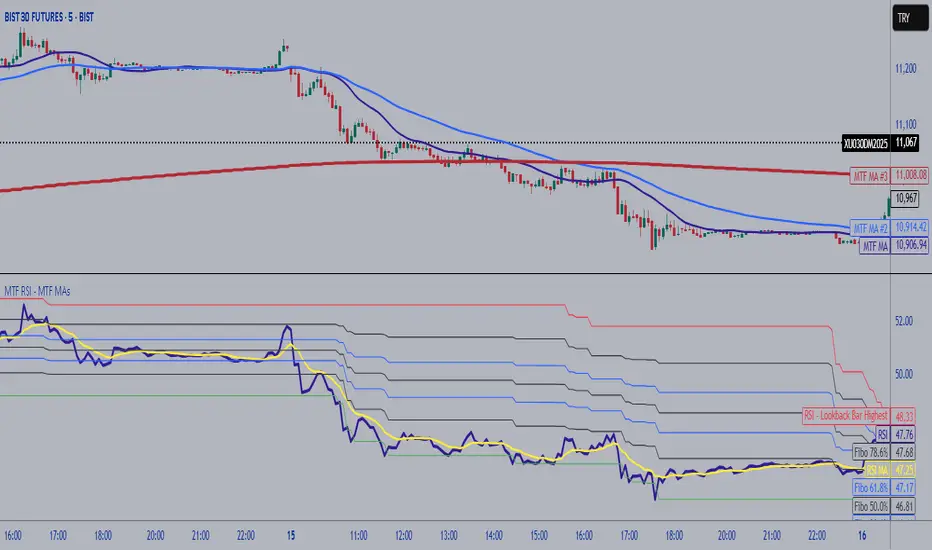
MTF RSI Fibonacci Levels & MTF Moving Avreages (EMA-SMA-WMA)
Thanks for Kadir Türok Özdamar. @kadirturokozdmr
Formula Purpose of Use
This formula combines the traditional RSI indicator with Fibonacci levels to create a special technical indicator that aims to identify potential support and resistance points:
Thanks for Kadir Türok Özdamar. @kadirturokozdmr
Formula Purpose of Use
This formula combines the traditional RSI indicator with Fibonacci levels to create a special technical indicator that aims to identify potential support and resistance points:
Determines the historical RSI range of 144 periods (PEAK and DIP)
Calculates Fibonacci retracement levels within this range, and shows the direction of momentum by calculating the moving average of the RSI
This indicator can be used to identify potential reversal points, especially when the RSI is not in overbought (70+) or oversold (30-) areas.
Practical Use
Investors can use this indicator as follows:
1⃣When the RSI approaches one of the determined Fibonacci levels, it is considered a potential support/resistance area.
2⃣When the RSI approaches the DIP level, it can be interpreted as oversold, and when it approaches the PEAK level, it can be interpreted as overbought.
3⃣When the RSI crosses the SM (moving average) line upwards or downwards, it can be evaluated as a momentum change signal.
4⃣Fibonacci levels (especially M386, M500 and M618) can be monitored as important transition zones for the RSI.
--------------------------------------------
In this version, some features and a multi-timeframe averages (SMA-EMA-WMA) were added to the script. It was made possible for the user to enter multi-timeframe RSI and multi-timeframe Fibo lengths.
Formula Purpose of Use
This formula combines the traditional RSI indicator with Fibonacci levels to create a special technical indicator that aims to identify potential support and resistance points:
Thanks for Kadir Türok Özdamar. @kadirturokozdmr
Formula Purpose of Use
This formula combines the traditional RSI indicator with Fibonacci levels to create a special technical indicator that aims to identify potential support and resistance points:
Determines the historical RSI range of 144 periods (PEAK and DIP)
Calculates Fibonacci retracement levels within this range, and shows the direction of momentum by calculating the moving average of the RSI
This indicator can be used to identify potential reversal points, especially when the RSI is not in overbought (70+) or oversold (30-) areas.
Practical Use
Investors can use this indicator as follows:
1⃣When the RSI approaches one of the determined Fibonacci levels, it is considered a potential support/resistance area.
2⃣When the RSI approaches the DIP level, it can be interpreted as oversold, and when it approaches the PEAK level, it can be interpreted as overbought.
3⃣When the RSI crosses the SM (moving average) line upwards or downwards, it can be evaluated as a momentum change signal.
4⃣Fibonacci levels (especially M386, M500 and M618) can be monitored as important transition zones for the RSI.
--------------------------------------------
In this version, some features and a multi-timeframe averages (SMA-EMA-WMA) were added to the script. It was made possible for the user to enter multi-timeframe RSI and multi-timeframe Fibo lengths.
Skrip dilindungi
Skrip ini diterbitkan sebagai sumber tertutup. Akan tetapi, anda boleh menggunakannya secara bebas dan tanpa apa-apa had – ketahui lebih di sini.
Penafian
Maklumat dan penerbitan adalah tidak bertujuan, dan tidak membentuk, nasihat atau cadangan kewangan, pelaburan, dagangan atau jenis lain yang diberikan atau disahkan oleh TradingView. Baca lebih dalam Terma Penggunaan.