PROTECTED SOURCE SCRIPT
RSI Trendlines [RG]
Overview
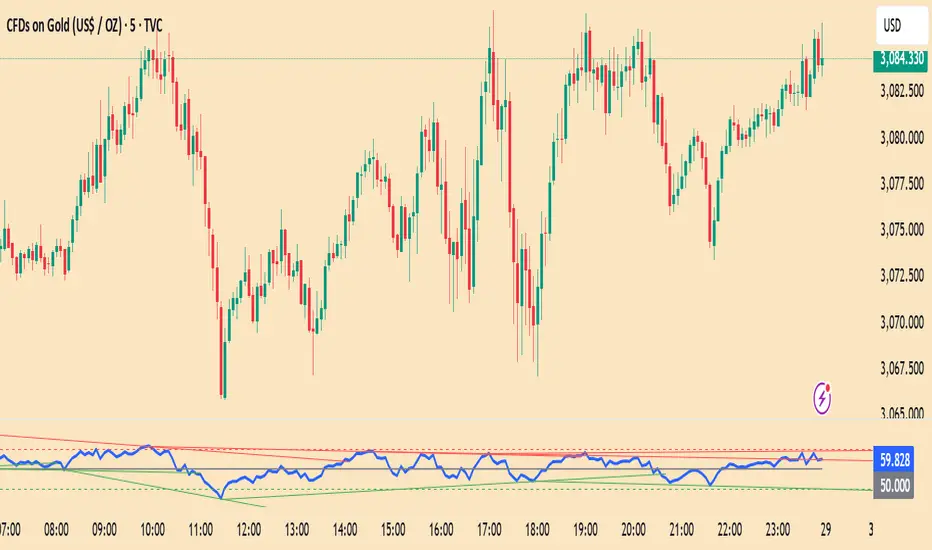
RSI Trendlines combines the power of automatic trendline detection with the popular Relative Strength Index (RSI) indicator. This tool identifies and plots dynamic support and resistance trendlines directly on the RSI chart, helping you spot potential trend changes and divergences in momentum before they appear in price.
Key Features
How It Works
Customization Options
Ideal For
This indicator aims to help traders move beyond static overbought/oversold levels by revealing the dynamic structure of momentum trends and highlighting potential reversals and continuations.
Please don't use this as a buy and sell indicator. Use it to get an idea on the market trend and as an extra confirmation for your trades. Happy Trading :)
RSI Trendlines combines the power of automatic trendline detection with the popular Relative Strength Index (RSI) indicator. This tool identifies and plots dynamic support and resistance trendlines directly on the RSI chart, helping you spot potential trend changes and divergences in momentum before they appear in price.
Key Features
- Automatically detects and draws trendlines on the RSI indicator
- Identifies significant pivot points in RSI momentum
- Customizable appearance with adjustable colors and line widths
- Built-in alerts for trendline breaks
How It Works
- The indicator calculates the standard RSI using your preferred settings
- It identifies pivot highs and lows in the RSI using the specified lookback period
- Valid trendlines are drawn connecting consecutive pivots
- Lines extend until they experience a confirmed break
Customization Options
- RSI Parameters: Adjust length and source to your preference
- Trendline Settings: Control pivot detection sensitivity and maximum lines
- Visual Options: Customize colors, line widths, and optional midline display
Ideal For
- Identifying established trends in momentum
- Spotting potential RSI divergences early
- Timing entries and exits based on momentum shifts
- Confirming trend changes with objective trendline breaks
This indicator aims to help traders move beyond static overbought/oversold levels by revealing the dynamic structure of momentum trends and highlighting potential reversals and continuations.
Please don't use this as a buy and sell indicator. Use it to get an idea on the market trend and as an extra confirmation for your trades. Happy Trading :)
Skrip dilindungi
Skrip ini diterbitkan sebagai sumber tertutup. Akan tetapi, anda boleh menggunakannya secara bebas dan tanpa apa-apa had – ketahui lebih di sini.
Penafian
Maklumat dan penerbitan adalah tidak bertujuan, dan tidak membentuk, nasihat atau cadangan kewangan, pelaburan, dagangan atau jenis lain yang diberikan atau disahkan oleh TradingView. Baca lebih dalam Terma Penggunaan.