OPEN-SOURCE SCRIPT
Telah dikemas kini Faytterro Estimator
What is Faytterro Estimator?
This indicator is an advanced moving average.
What it does?
This indicator is both a moving average and at the same time, it predicts the future values that the price may take based on the values it has taken before.
How it does it?
takes the weighted average of data of the selected length (reducing the weight from the middle to the ends). then draws a parabola through the last three values, creating a predicted line.
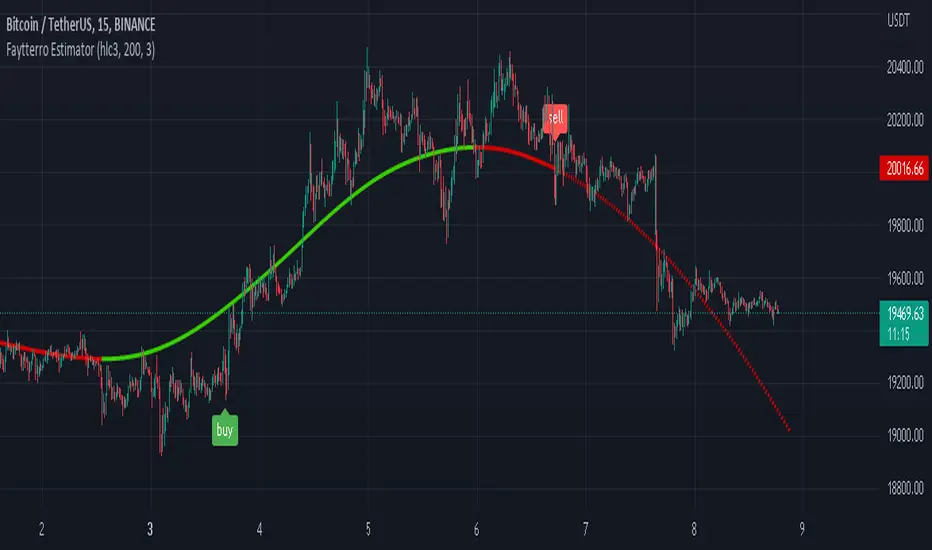
How to use it?
it is simple to use. You can use it both as a regression to review past prices, and to predict the future value of a price. uptrends are in green and downtrends are in red. color change indicates a possible trend change.
 https://www.tradingview.com/x/fzfhc2bj/
This indicator is an advanced moving average.
What it does?
This indicator is both a moving average and at the same time, it predicts the future values that the price may take based on the values it has taken before.
How it does it?
takes the weighted average of data of the selected length (reducing the weight from the middle to the ends). then draws a parabola through the last three values, creating a predicted line.
How to use it?
it is simple to use. You can use it both as a regression to review past prices, and to predict the future value of a price. uptrends are in green and downtrends are in red. color change indicates a possible trend change.
Nota Keluaran
buy-sell signal added. the signals are not repaint.Nota Keluaran
added strong buy-sell signalsNota Keluaran
alert added. only the last "lenght" value of the drawing is repaint. There is no repaint on buy-sell signals. Single candle errors may occur if you only select "close" or a different variable as the source. To prevent this, you can make "open" the source part. in this case you will never get a false signal.
Nota Keluaran
max lenght increased from 49 to 99.estimated values are now displayed as dashed lines.
new view:
Nota Keluaran
bug fixed.Nota Keluaran
"maxval" increased to 499.Nota Keluaran
The problem that caused the old lines not to disappear has been resolved.Nota Keluaran
Added color change option.Nota Keluaran
The issue that caused the indicator to disappear after a while has been resolved.Skrip sumber terbuka
Dalam semangat sebenar TradingView, pencipta skrip ini telah menjadikannya sumber terbuka supaya pedagang dapat menilai dan mengesahkan kefungsiannya. Terima kasih kepada penulis! Walaupun anda boleh menggunakannya secara percuma, ingat bahawa menerbitkan semula kod ini adalah tertakluk kepada Peraturan Dalaman kami.
Penafian
Maklumat dan penerbitan adalah tidak dimaksudkan untuk menjadi, dan tidak membentuk, nasihat untuk kewangan, pelaburan, perdagangan dan jenis-jenis lain atau cadangan yang dibekalkan atau disahkan oleh TradingView. Baca dengan lebih lanjut di Terma Penggunaan.
Skrip sumber terbuka
Dalam semangat sebenar TradingView, pencipta skrip ini telah menjadikannya sumber terbuka supaya pedagang dapat menilai dan mengesahkan kefungsiannya. Terima kasih kepada penulis! Walaupun anda boleh menggunakannya secara percuma, ingat bahawa menerbitkan semula kod ini adalah tertakluk kepada Peraturan Dalaman kami.
Penafian
Maklumat dan penerbitan adalah tidak dimaksudkan untuk menjadi, dan tidak membentuk, nasihat untuk kewangan, pelaburan, perdagangan dan jenis-jenis lain atau cadangan yang dibekalkan atau disahkan oleh TradingView. Baca dengan lebih lanjut di Terma Penggunaan.