PROTECTED SOURCE SCRIPT
DT_Gann
DT_Gann - Combined Indicator Description
This TradingView indicator implements W.D. Gann's Square 9 concept with several visual enhancements to help traders identify key support and resistance levels. The indicator automatically adapts to different market types (forex or stocks) and includes the following features:
KEY FEATURES:
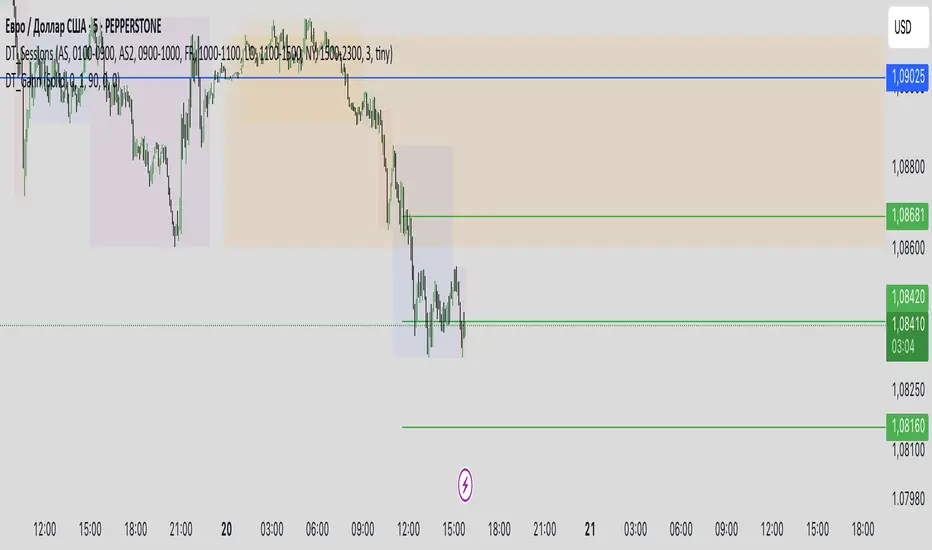
Support and resistance levels:
Automatically calculates and displays multiple support and resistance levels based on the Gann square theory of 9, with customizable colors (default green for support, red for resistance).
Day Opening Line:
Shows the day's opening price as a reference point, which serves as the base for all Gann calculations.
Previous 4H Range Box:
Displays a rectangular box showing the high-llow range of the previous day's last 4-hour candle, helping traders identify important price zones.
Vertical Time Lines:
Additional temporary vertical lines marking 4-hour intervals to help visualize potential reversal points.
Reject Mode:
Allows you to fine-tune support and resistance levels using percentage deviations.
CUSTOMIZATION OPTIONS:
Line Styles:
Select a solid, dashed, or dotted line.
Colors:
Adjust colors for support, resistance, daily open line, 4H rectangle and time lines.
Line Width:
Customize the thickness of all lines (1-5 pixels)
Opacity settings:
Control the transparency of various elements
Deviation settings:
Apply percentage adjustments to support and resistance levels
TECHNICAL IMPLEMENTATION:
Indicator:
- Automatically determines the appropriate point values depending on the instrument.
- Calculates Gann levels using the mathematical principle of Square 9.
- Finds the nearest support and resistance levels relative to the current price.
- Creates visualizations based on both charts and lines.
- Dynamically updates as price moves.
USAGE:
This indicator is especially useful for swing traders and day traders who follow Gann methods. The combination of price levels (support/resistance) and time markers (vertical lines) helps identify potential reversal zones where price and time align according to Gann principles.
The previous day's 4-hour rectangular frame often serves as an important reference zone that price can return to or respect.
The indicator works on all timeframes, but is most effective on charts from 15-minute to 4-hour charts, where time-based components provide the most value.
This TradingView indicator implements W.D. Gann's Square 9 concept with several visual enhancements to help traders identify key support and resistance levels. The indicator automatically adapts to different market types (forex or stocks) and includes the following features:
KEY FEATURES:
Support and resistance levels:
Automatically calculates and displays multiple support and resistance levels based on the Gann square theory of 9, with customizable colors (default green for support, red for resistance).
Day Opening Line:
Shows the day's opening price as a reference point, which serves as the base for all Gann calculations.
Previous 4H Range Box:
Displays a rectangular box showing the high-llow range of the previous day's last 4-hour candle, helping traders identify important price zones.
Vertical Time Lines:
Additional temporary vertical lines marking 4-hour intervals to help visualize potential reversal points.
Reject Mode:
Allows you to fine-tune support and resistance levels using percentage deviations.
CUSTOMIZATION OPTIONS:
Line Styles:
Select a solid, dashed, or dotted line.
Colors:
Adjust colors for support, resistance, daily open line, 4H rectangle and time lines.
Line Width:
Customize the thickness of all lines (1-5 pixels)
Opacity settings:
Control the transparency of various elements
Deviation settings:
Apply percentage adjustments to support and resistance levels
TECHNICAL IMPLEMENTATION:
Indicator:
- Automatically determines the appropriate point values depending on the instrument.
- Calculates Gann levels using the mathematical principle of Square 9.
- Finds the nearest support and resistance levels relative to the current price.
- Creates visualizations based on both charts and lines.
- Dynamically updates as price moves.
USAGE:
This indicator is especially useful for swing traders and day traders who follow Gann methods. The combination of price levels (support/resistance) and time markers (vertical lines) helps identify potential reversal zones where price and time align according to Gann principles.
The previous day's 4-hour rectangular frame often serves as an important reference zone that price can return to or respect.
The indicator works on all timeframes, but is most effective on charts from 15-minute to 4-hour charts, where time-based components provide the most value.
Skrip dilindungi
Skrip ini diterbitkan sebagai sumber tertutup. Akan tetapi, anda boleh menggunakannya secara bebas dan tanpa apa-apa had – ketahui lebih di sini.
Penafian
Maklumat dan penerbitan adalah tidak bertujuan, dan tidak membentuk, nasihat atau cadangan kewangan, pelaburan, dagangan atau jenis lain yang diberikan atau disahkan oleh TradingView. Baca lebih dalam Terma Penggunaan.