OPEN-SOURCE SCRIPT
Swing Highs and Lows (version 2)
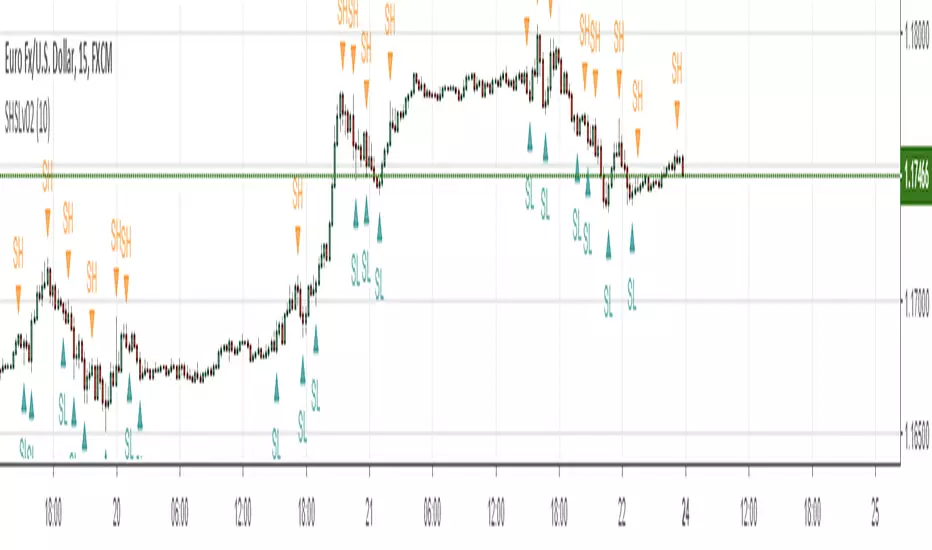
My second version of plotting Swing Highs and Swing Lows
A Swing High (SH): a price bar high preceed by two lower highs (LH) and followed by two lower highs (LH)
This version enables you to ignores swing highs and lows when the market volatility is small and not suitable for trading.
Thus it will depict fewer number of SH and SL markers, making the chart a bit cleaner and easier for us to read.
Volatility is measured simply by the amount of pips moved within five consecutive bars: the default is set at 10 pips, meaning that when you take five consecutive bars and the gap of the highest high and the lowest low is less than or equal to 10 pips, it will not depict SH or SL markers.
To use this function, check "set volatility threshold?" box under the Format icon and set a threshold in pips.
(I typically trade EURUSD so the pips input is customized for that)
Skrip sumber terbuka
Dalam semangat sebenar TradingView, pencipta skrip ini telah menjadikannya sumber terbuka supaya pedagang dapat menilai dan mengesahkan kefungsiannya. Terima kasih kepada penulis! Walaupun anda boleh menggunakannya secara percuma, ingat bahawa menerbitkan semula kod ini adalah tertakluk kepada Peraturan Dalaman kami.
Penafian
Maklumat dan penerbitan adalah tidak dimaksudkan untuk menjadi, dan tidak membentuk, nasihat untuk kewangan, pelaburan, perdagangan dan jenis-jenis lain atau cadangan yang dibekalkan atau disahkan oleh TradingView. Baca dengan lebih lanjut di Terma Penggunaan.