OPEN-SOURCE SCRIPT
Telah dikemas kini Price - Mean Reversion Expansion
A simple indicator, to plot the quantitatively the reversion and expansion of price from a set of means.
A green bar plots prices above the set of means. A bar plots prices below the set of means. A blue bar plots price entangled in the means. The height of the bars denotes the far-ness from the set of means.
A blue envelope over the bars is the average of this reversion/expansion. A "crossover" of any bar (red/green) over this envelope is indicated by a "green dot" a "crossunder" of any bar (red/green) under this envelope is indicated by a "red dot".
The small trend strength table (when enabled) on the right side below show in a easy manner the data presented in the "Mean Angles" indicator. Refer to description there for more details.
Nota Keluaran
- Added Price Delta, scaled price performance
Added an overlap of scaled price movement vis-a-vis the expansion and contraction. Clearly identifies the trend changes and objectively defines expansion and reversion.
Nota Keluaran
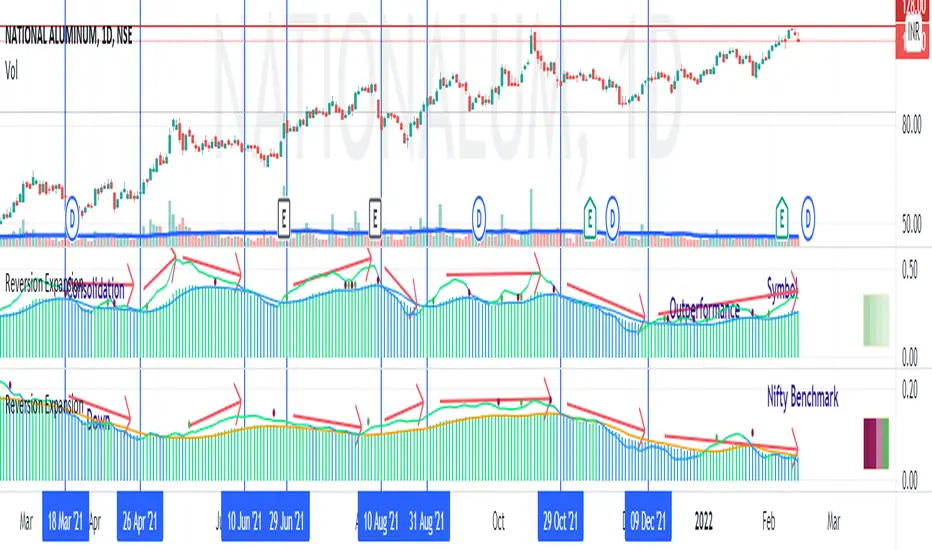
- Option to select another symbol (benchmark) instead of the chart symbol
This option will help in measuring the reversion / expansion vis-a-vis broader benchmark when placed side-by-side. When the other symbol (benchmark is ticked, the envelope will be of orange color and not the usual blue color. This will help in quick identification.
Refer to
The lower plot is orange envelope, that of the benchmark. We can clearly observe regions where the symbol followed the benchmark, outperforms or lags the benchmark. This analysis can be done over multiple timeframes.
Nota Keluaran
- Fixed other symbol EMA calculations when valid mean length of symbol starts later than benchmark
Nota Keluaran
- Update Pine Script version 6
- Alert conditions and TrendLength additions - for Pine Screener
Skrip sumber terbuka
Dalam semangat TradingView sebenar, pencipta skrip ini telah menjadikannya sumber terbuka, jadi pedagang boleh menilai dan mengesahkan kefungsiannya. Terima kasih kepada penulis! Walaupuan anda boleh menggunakan secara percuma, ingat bahawa penerbitan semula kod ini tertakluk kepada Peraturan Dalaman.
Penafian
Maklumat dan penerbitan adalah tidak bertujuan, dan tidak membentuk, nasihat atau cadangan kewangan, pelaburan, dagangan atau jenis lain yang diberikan atau disahkan oleh TradingView. Baca lebih dalam Terma Penggunaan.