Open/Close Volume
The Open/Close Volume Indicator provides a breakdown of trading volume based on Open Interest (OI) changes. It helps identify whether the trading volume is driven by opening new positions (Open Volume) or closing existing positions (Close Volume).
Key Features:
- Visual Breakdown of Volume:
Green bars represent Open Volume (new positions being added).
Red bars represent Close Volume (existing positions being closed). - Dynamic Open Interest Data: Tracks changes in Open Interest to calculate the distribution of Open and Close Volumes.
Adapts automatically to the current chart's symbol or a custom user-specified symbol. - Error Handling: Displays an alert when Open Interest data is unavailable for the selected symbol.
- Zero-Line Reference:
- Includes a gray dotted line at 0 for easy reference between Open and Close Volumes.
- Includes a gray dotted line at 0 for easy reference between Open and Close Volumes.
Use Case:
This indicator is ideal for futures traders who want to analyze market sentiment and understand whether market activity is being driven by the initiation of new trades or the closing of existing ones.
How It Works:
- Open Interest Change: Positive OI change → Open Volume.
Negative OI change → Close Volume.
No OI change → All trading volume is considered Close Volume. - Data Representation:
- Open Volume is plotted above the zero line (positive values).
- Close Volume is plotted below the zero line (negative values).
- Open Volume is plotted above the zero line (positive values).
An advanced volume analysis tool utilizing Open Interest (OI) data to track market positioning.
🔍 Overview
This indicator provides a unique way to separate Open Volume and Close Volume, giving traders insight into whether the market is driven by new contract openings or position closings.
Additionally, it features a Dominance metric, visually representing whether more contracts are being opened or closed over time, helping traders gauge shifts in market behavior.
📌 Key Features:
- [] Tracks Open and Close Volume based on Open Interest movements.
[] Visualizes market participation trends with a unique Dominance metric.
[] Customizable color settings for Open Volume, Close Volume, and Dominance.
[] Works on all futures contracts where Open Interest data is available.
📊 How It Works (Conceptual Explanation)
- [] Open Interest Change is used to detect market positioning shifts.
[] Volume is categorized into Open Volume and Close Volume to help distinguish market intent. - Dominance measures the balance between opening and closing contracts and displays it in an easy-to-read visual format.
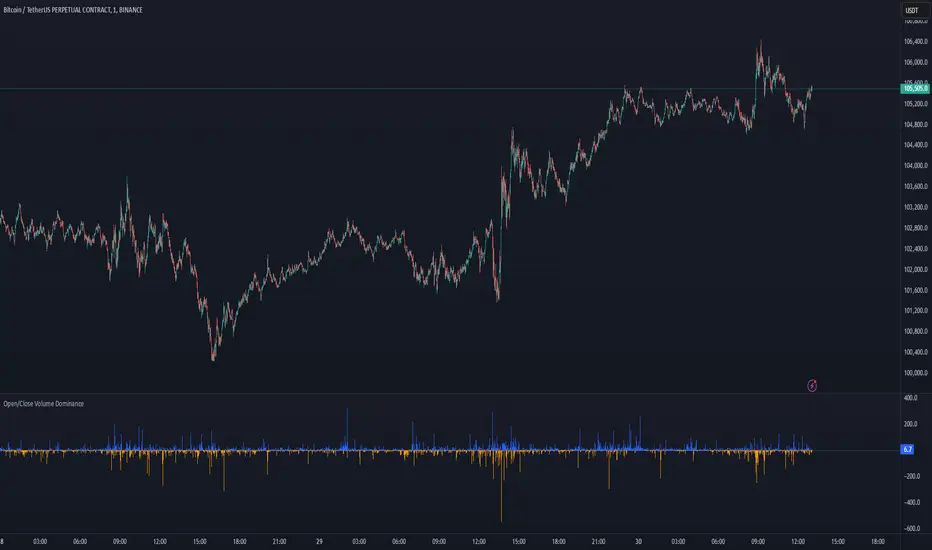
📌 What You See on the Chart:
- [] [color=green]Green bars:[/color] Represent Open Volume (contracts being opened).
[] [color=red]Red bars:[/color] Represent Close Volume (contracts being closed).
[] [color=blue]Blue dominance bars:[/color] More contracts opened than closed.
[] [color=orange]Orange dominance bars:[/color] More contracts closed than opened.
This methodology allows traders to analyze market participation without relying solely on price movement.
⚡ How to Use This Indicator
This indicator helps you analyze market positioning dynamics by tracking contract openings vs. closings based on Open Interest (OI) changes.
📌 Key Interpretations:
- [] [color=blue]🔵 Blue Dominance Bars[/color] → Indicate higher contract openings relative to closings.
[] [color=orange]🟠 Orange Dominance Bars[/color] → Indicate higher contract closings relative to openings. - Compare Open/Close Volume with price movement to identify potential market behavior shifts.
📊 Market Action & Open Interest Changes
The table below explains how different market actions impact Open Interest.
By analyzing Open/Close Volume and Dominance along with price movement, traders can better understand market positioning and potential liquidity shifts. 🚀
⚙️ Customization Options
- Users can adjust colors for:
Open Volume (default: Green)
Close Volume (default: Red)
Dominance (More Opened Contracts) (default: Blue)
Dominance (More Closed Contracts) (default: Orange) - By default, only Dominance is enabled (Open/Close Volume can be manually turned on).
🚀 Why This Indicator is Unique
- [] Provides exclusive insights into market positioning using Open Interest.
[] Offers a new way to analyze contract flows in futures markets.
[] Works seamlessly on Futures and Derivatives markets.
[] Fully customizable for different trading strategies.
📌 Important Notes
- [] This indicator is designed for Futures traders and relies on Open Interest data.
[] It does not work on spot markets (e.g., BTC/USD) since spot markets do not have Open Interest.
📈 Example Use Cases
- [] Detect institutional positioning changes by tracking Open Interest shifts.
[] Identify potential trend reversals when market positioning changes significantly. - Combine with price action or technical indicators for a complete trading strategy.
📢 Disclaimer
This script is for educational purposes only. It does not provide financial advice or guarantee future results. Use it alongside proper risk management and other trading strategies.
✅ Summary
📊 Open/Close Volume + Dominance is an innovative tool designed to help traders monitor contract openings and closings using Open Interest data. By analyzing these shifts in market positioning, traders can gain deeper insights into market behavior and liquidity flows.
🚀 Try it now & let us know your feedback! 🔥🔥🔥
Skrip jemputan sahaja
Hanya pengguna yang diberikan kebenaran oleh penulis mempunyai akses kepada skrip ini dan ini selalunya memerlukan pembayaran. Anda boleh menambahkan skrip kepada kegemaran anda tetapi anda hanya boleh menggunakannya selepas meminta kebenaran dan mendapatkannya daripada penulis — ketarhui lebih lanjut di sini. Untuk lebih butiran, ikuti arahan penulis di bawah atau hubungi Angick secara terus.
TradingView tidak menyarankan pembayaran untuk atau menggunakan skrip kecuali anda benar-benar mempercayai penulisnya dan memahami bagaimana ia berfungsi. Anda juga boleh mendapatkan alternatif sumber terbuka lain yang percuma dalam skrip komuniti kami.
Arahan penulis
Amaran: sila baca panduan kami untuk skrip jemputan sahaja sebelum memohon akses.
Penafian
Skrip jemputan sahaja
Hanya pengguna yang diberikan kebenaran oleh penulis mempunyai akses kepada skrip ini dan ini selalunya memerlukan pembayaran. Anda boleh menambahkan skrip kepada kegemaran anda tetapi anda hanya boleh menggunakannya selepas meminta kebenaran dan mendapatkannya daripada penulis — ketarhui lebih lanjut di sini. Untuk lebih butiran, ikuti arahan penulis di bawah atau hubungi Angick secara terus.
TradingView tidak menyarankan pembayaran untuk atau menggunakan skrip kecuali anda benar-benar mempercayai penulisnya dan memahami bagaimana ia berfungsi. Anda juga boleh mendapatkan alternatif sumber terbuka lain yang percuma dalam skrip komuniti kami.
Arahan penulis
Amaran: sila baca panduan kami untuk skrip jemputan sahaja sebelum memohon akses.