OPEN-SOURCE SCRIPT
Bollinger and Stochastic with Trailing Stop - D.M.P.
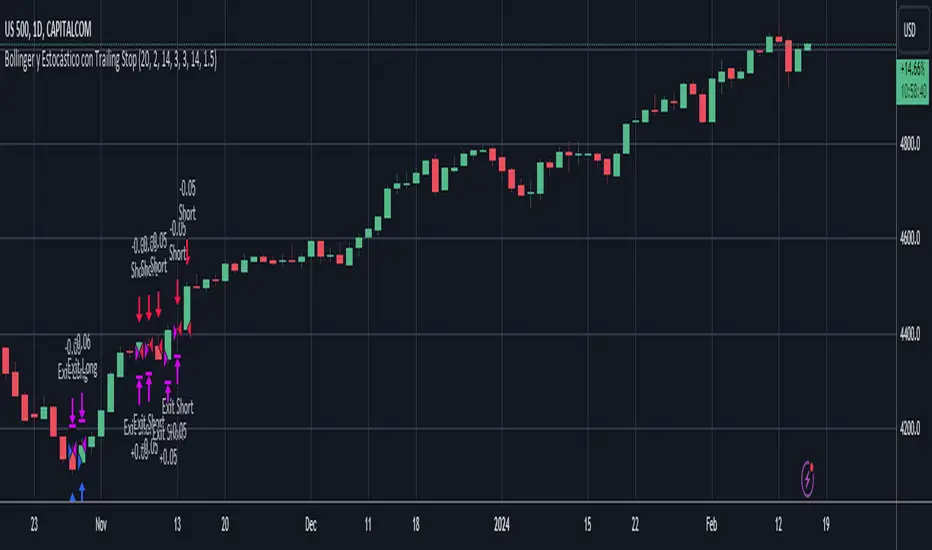
This trading strategy combines Bollinger Bands and the Stochastic indicator to identify entry opportunities in oversold and overbought conditions in the market. The aim is to capitalize on price rebounds from the extremes defined by the Bollinger Bands, with the confirmation of the Stochastic to maximize the probability of success of the operations.
Indicators Used
- Bollinger Bands Used to measure volatility and define oversold and overbought levels. When the price touches or breaks through the lower band, it indicates a possible oversold condition. Similarly, when it touches or breaks through the upper band, it indicates a possible overbought condition.
- Stochastic: A momentum oscillator that compares the closing price of an asset with its price range over a certain period. Values below 20 indicate oversold, while values above 80 indicate overbought.
Strategy Logic
- Long Entry (Buy): A purchase operation is executed when the price closes below the lower Bollinger band (indicating oversold) and the Stochastic is also in the oversold zone.
- Short Entry (Sell): A sell operation is executed when the price closes above the upper Bollinger band (indicating overbought) and the Stochastic is in the overbought zone.
Skrip sumber terbuka
Dalam semangat TradingView sebenar, pencipta skrip ini telah menjadikannya sumber terbuka, jadi pedagang boleh menilai dan mengesahkan kefungsiannya. Terima kasih kepada penulis! Walaupuan anda boleh menggunakan secara percuma, ingat bahawa penerbitan semula kod ini tertakluk kepada Peraturan Dalaman.
Penafian
Maklumat dan penerbitan adalah tidak bertujuan, dan tidak membentuk, nasihat atau cadangan kewangan, pelaburan, dagangan atau jenis lain yang diberikan atau disahkan oleh TradingView. Baca lebih dalam Terma Penggunaan.