PROTECTED SOURCE SCRIPT
Telah dikemas kini RSI MTF HW
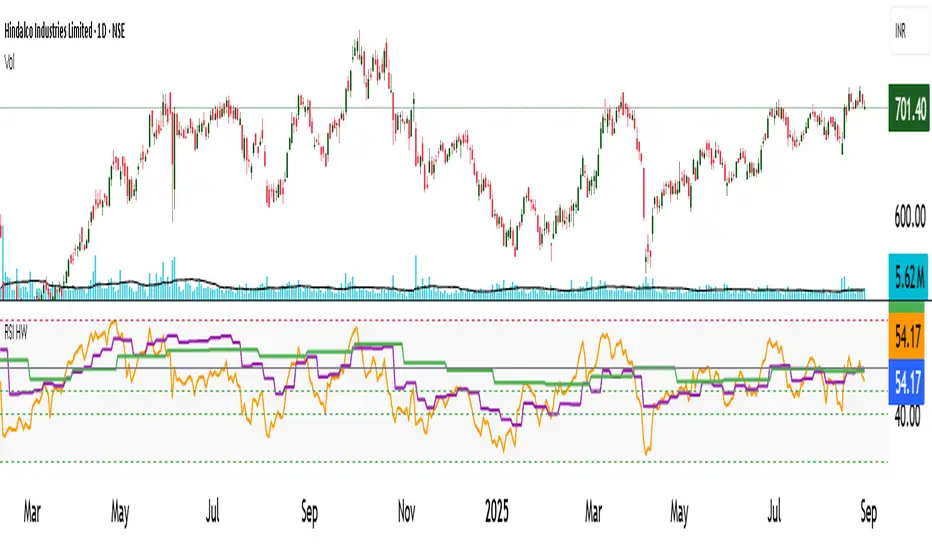
This Pine Script indicator is designed to provide a comprehensive view of market momentum by plotting the Relative Strength Index (RSI) from four different time frames simultaneously on a single chart. This allows traders to quickly identify alignment or divergence in momentum across various time horizons, which can be a powerful tool for confirming trade setups or spotting potential trend reversals.
Key Features:
Customizable Inputs: The indicator provides a flexible set of user inputs, including a dropdown menu to select the data source for the RSI calculation (e.g., close, open, high, low). You can also define four separate RSI lengths to analyze different periods.
Multi-Time Frame Analysis: A key feature is the ability to choose a time frame for each of the four RSI lines from a predefined list (Chart, 1 day, 1 week, 1 month). The script uses the request.security() function with lookahead enabled to ensure the most accurate, real-time data is used for each calculation, eliminating look-ahead bias and calculation errors.
Visual Levels: The indicator plots standard RSI levels at 30, 50, and 70, with a shaded background between the oversold (30) and overbought (70) zones to provide a clear visual reference.
Momentum Alignment Signals: The script includes an optional feature that highlights the chart's background with a red or green color when all four RSIs simultaneously enter an overbought or oversold state. This serves as an immediate visual alert for a strong, multi-time frame momentum condition.
This indicator is a robust tool for technical analysis, suitable for traders who use a top-down approach to their market analysis.
Nota Keluaran
This Pine Script indicator is designed to provide a comprehensive view of market momentum by plotting the Relative Strength Index (RSI) from four different time frames simultaneously on a single chart. This allows traders to quickly identify alignment or divergence in momentum across various time horizons, which can be a powerful tool for confirming trade setups or spotting potential trend reversals.Key Features:
Customizable Inputs: The indicator provides a flexible set of user inputs, including a dropdown menu to select the data source for the RSI calculation (e.g., close, open, high, low). You can also define four separate RSI lengths to analyze different periods.
Multi-Time Frame Analysis: A key feature is the ability to choose a time frame for each of the four RSI lines from a predefined list (Chart, 1 day, 1 week, 1 month). The script uses the request.security() function with lookahead enabled to ensure the most accurate, real-time data is used for each calculation, eliminating look-ahead bias and calculation errors.
Visual Levels: The indicator plots standard RSI levels at 30, 50, and 70, with a shaded background between the oversold (30) and overbought (70) zones to provide a clear visual reference.
Momentum Alignment Signals: The script includes an optional feature that highlights the chart's background with a red or green color when all four RSIs simultaneously enter an overbought or oversold state. This serves as an immediate visual alert for a strong, multi-time frame momentum condition.
This indicator is a robust tool for technical analysis, suitable for traders who use a top-down approach to their market analysis.
Skrip dilindungi
Skrip ini diterbitkan sebagai sumber tertutup. Akan tetapi, anda boleh menggunakannya secara bebas dan tanpa apa-apa had – ketahui lebih di sini.
Penafian
Maklumat dan penerbitan adalah tidak bertujuan, dan tidak membentuk, nasihat atau cadangan kewangan, pelaburan, dagangan atau jenis lain yang diberikan atau disahkan oleh TradingView. Baca lebih dalam Terma Penggunaan.