PROTECTED SOURCE SCRIPT
VT - Dashboard04
🚀Overview
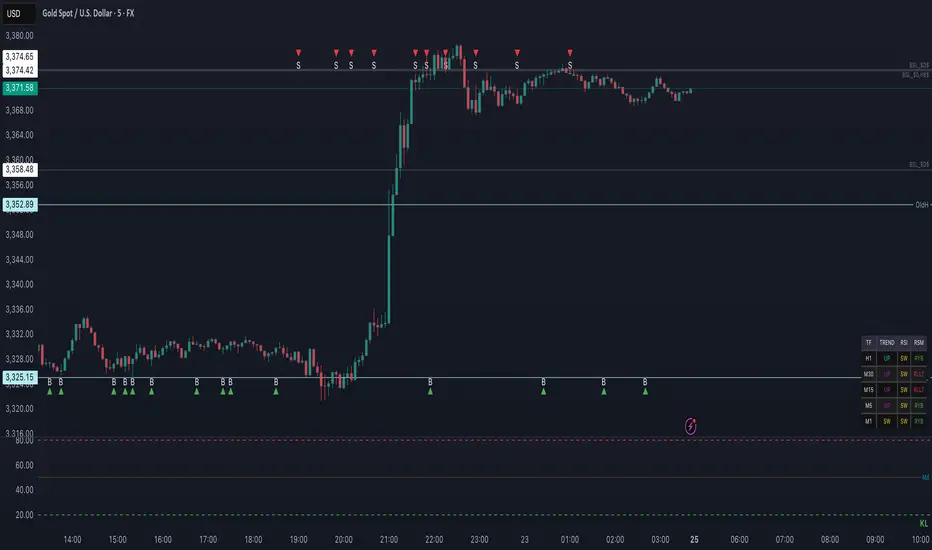
The VT - Dashboard04 is an all-in-one technical analysis powerhouse designed for traders who demand clarity and confluence. This tool eliminates the need to flip between timeframes by providing a real-time snapshot of trend, momentum, and RSI conditions across five key timeframes (H1, M30, M15, M5, M1) in a single, sleek dashboard. Simultaneously, it scans the current chart for high-probability candlestick rejection patterns, generating precise buy and sell signals when confirmed by the underlying trend structure. It's your ultimate multi-timeframe trading assistant.
✨ Key Features
📊 Multi-Timeframe Dashboard: Instantly view Trend, RSI State, and RSM Momentum for H1, M30, M15, M5, and M1.
🎯 Smart Pattern Recognition: Advanced algorithm detects three types of rejection patterns (Type 1, Type 2, Pin Bars) for high-quality entry signals.
⚡ Confluence-Based Logic: Signals only trigger when rejection patterns are confirmed by the EMA trend (cross or alignment), ensuring higher-probability setups.
⚙️ Full Customization: Adjust the dashboard's position, toggle compact mode, and fine-tune all strategy parameters (EMA lengths, RSI levels) to fit your style.
🔔 Built-In Alert Conditions: Pre-configured alerts for "Buy Alert" and "Sell Alert" mean you never miss a trading opportunity.
🛠How to Use
Apply the indicator to any chart.
Glance at the dashboard to assess multi-timeframe momentum alignment (e.g., all timeframes in "UP" trend).
Watch for "B" (Bullish Rejection) or "S" (Bearish Rejection) labels printed on the chart.
A full Buy Signal (green arrow) appears for a confirmed bullish setup. A Sell Signal (red arrow) appears for a confirmed bearish setup.
Use the provided alerts to get notified of new signals automatically.
⚙️ Settings
Dashboard Settings: Choose from 4 screen positions and enable 50% smaller compact mode.
EMA Logic: Adjust the lengths of the Fast and Slow EMAs.
RSI Logic: Customize the RSI Length and Overbought/Oversold levels.
RSM Logic: Tune the RSI Length and EMA Smoothing for the momentum oscillator.
📈Trading Concepts
This indicator synthesizes several powerful concepts:
Multi-Timeframe Analysis: Confirming the trend across higher timeframes increases the probability of a successful trade on a lower timeframe.
Trend Following: Using a stacked EMA (Fast > Mid > Slow) system to define bullish and bearish market bias.
Momentum: Using the RSI to identify overbought and oversold conditions and its own EMA for momentum direction.
Price Action: Identifying key reversal patterns where price has been "rejected" from a level, indicating a potential change in direction.
Note: This is a technical analysis tool. Always practice proper risk management and combine with other analysis techniques for best results.
Category: Technical Analysis
Version: 1.0
Developer: VT
Skrip dilindungi
Skrip ini diterbitkan sebagai sumber tertutup. Akan tetapi, anda boleh menggunakannya dengan percuma dan tanpa had – ketahui lebih lanjut di sini.
Penafian
Maklumat dan penerbitan adalah tidak dimaksudkan untuk menjadi, dan tidak membentuk, nasihat untuk kewangan, pelaburan, perdagangan dan jenis-jenis lain atau cadangan yang dibekalkan atau disahkan oleh TradingView. Baca dengan lebih lanjut di Terma Penggunaan.