OPEN-SOURCE SCRIPT
Telah dikemas kini Ultimate Webby RSI Pro [MNQ 3min]
Ultimate Webby RSI Pro – User Guide
I made it to use it on NQ micro futures on a 3-minute time frame.
What it does
Plots the RSI as a colored histogram (green above 50, red below 50, gray near 50).
Adds adaptive ATR-scaled bands around RSI to measure volatility-adjusted momentum.
Optional multi-timeframe RSI filter (choose a higher resolution to confirm signals).
Optional volume filter (signals only when volume is above average).
Detects potential bullish and bearish divergences.
Generates buy/sell alerts when RSI crosses 30/70 with wave/volume confirmation.
How to use it
Apply to a chart (default: MNQ 3m).
Look for Buy signals (green triangles) when RSI crosses upward through 30 with trend/volume confirmation.
Look for Sell signals (red triangles) when RSI crosses downward through 70 with trend/volume confirmation.
Use the colored histogram for quick momentum reading:
Green = bullish pressure
Red = bearish pressure
Gray = neutral/transition
Watch ATR bands: when RSI approaches/exceeds them, momentum may be stretched.
Divergence labels (“Bull Div” / “Bear Div”) highlight possible reversal zones.
Enable TradingView alerts from the “Webby RSI Buy/Sell Signal” conditions.
⚠️ Disclaimer
This script is provided for educational purposes only.
It is not financial advice, and past performance does not guarantee future results.
Always do your own research and use proper risk management before trading or investing.
Nota Keluaran
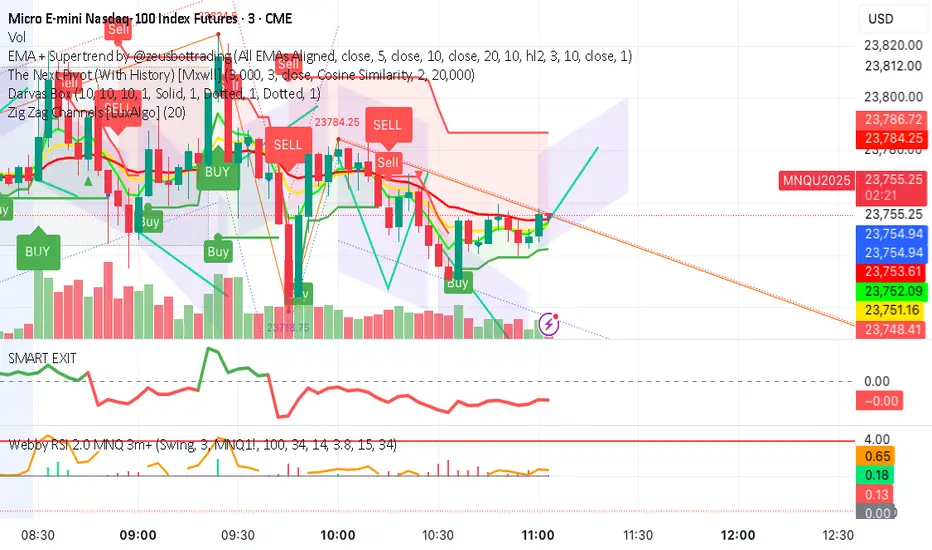
📌 Webby RSI 2.0 — MNQ 3m (Swing / Scalper + HTF Bias)🔎 Introduction
This is a flexible version of Amphibiantrading’s Webby RSI concept, optimized for MNQ 3-minute trading.
It normalizes the distance of price from moving averages (EMA/SMA) using ATR, producing stretch histograms that highlight overextended moves.
I extended it with:
✅ Swing and Scalper presets (instantly switch via dropdown)
✅ Custom mode (type in your own parameters)
✅ Optional HTF (Higher Timeframe) bias filter — e.g., only show longs when 15m trend is up
✅ Alerts for bull/bear stretches and SMA extension
⚙️ Core Logic
Green histogram = low above EMA (normalized by ATR) → bullish stretch
Red histogram = EMA above high → bearish stretch
Orange line = high above SMA → extension (useful for exhaustion / fade plays)
Stretch Level line = threshold (default depends on Swing vs Scalper preset)
📊 Presets
Choose in the Mode dropdown:
Swing (MNQ 3m)
ATR Length = 100
EMA Length = 34
SMA Length = 14
Stretched Level = 3.8
👉 Fewer, cleaner signals (approx 3–6/day).
Scalper (MNQ 3m)
ATR Length = 34
EMA Length = 13
SMA Length = 8
Stretched Level = 2.4
👉 More signals (approx 15–25/day).
Custom
Enter your own ATR/EMA/SMA/Level values.
🧭 HTF Bias Filter (optional)
Enable the toggle to align entries with a higher-timeframe trend.
Example: HTF timeframe = 15m, EMA(34)
If close > EMA → bull bias (only green/orange plots show)
If close < EMA → bear bias (only red plots show)
Optional background tint shows bias (green = bull, red = bear).
This reduces false signals and keeps you trading with the bigger move.
🚀 How to Use
Add the indicator → In settings, choose Mode (Swing/Scalper/Custom).
Leave Computation timeframe = 3 and Override symbol = MNQ1! for MNQ micro futures.
Watch for histogram/extension values crossing your Stretched Level.
Bull stretch above threshold = price stretched to upside.
Bear stretch above threshold = price stretched to downside.
SMA extension = price extended above SMA, often exhaustion.
(Optional) Turn on HTF Bias to only take trades in the main trend direction.
🔔 Alerts Included
Bull Stretch > Level (positive histogram crosses above level)
Bear Stretch > Level (negative histogram crosses above level)
SMA Extension > Level (SMA line crosses above level)
All alerts automatically respect the HTF bias filter if enabled.
⚠️ Notes & Best Practices
Stretched Level is not RSI OB/OS — it’s distance normalized by ATR. Combine with market structure (VWAP, supply/demand, session levels).
If using higher-TF calculations (via HTF bias), remember values finalize at the close of that TF bar.
Swing preset is better for holding through moves; Scalper preset is better for fast in/out trading.
Always combine with risk management — normalized stretch can still extend further in strong trends.
✅ Credits
Original Webby RSI by Amphibiantrading.
Extended by [Your Name] for flexible MNQ swing/scalp use with HTF filters.
⚖️ Disclaimer
This script is provided for educational purposes only. It does not constitute financial advice or an offer to buy or sell any financial instrument.
Trading futures, stocks, forex, and cryptocurrencies involves substantial risk and may not be suitable for every investor.
Past performance is not indicative of future results.
Always do your own research and consult with a licensed financial advisor before making any trading decisions.
Use at your own risk.
Skrip sumber terbuka
Dalam semangat sebenar TradingView, pencipta skrip ini telah menjadikannya sumber terbuka supaya pedagang dapat menilai dan mengesahkan kefungsiannya. Terima kasih kepada penulis! Walaupun anda boleh menggunakannya secara percuma, ingat bahawa menerbitkan semula kod ini adalah tertakluk kepada Peraturan Dalaman kami.
Penafian
Maklumat dan penerbitan adalah tidak dimaksudkan untuk menjadi, dan tidak membentuk, nasihat untuk kewangan, pelaburan, perdagangan dan jenis-jenis lain atau cadangan yang dibekalkan atau disahkan oleh TradingView. Baca dengan lebih lanjut di Terma Penggunaan.