TREND CIRCLE + DIVERGENCES overlay
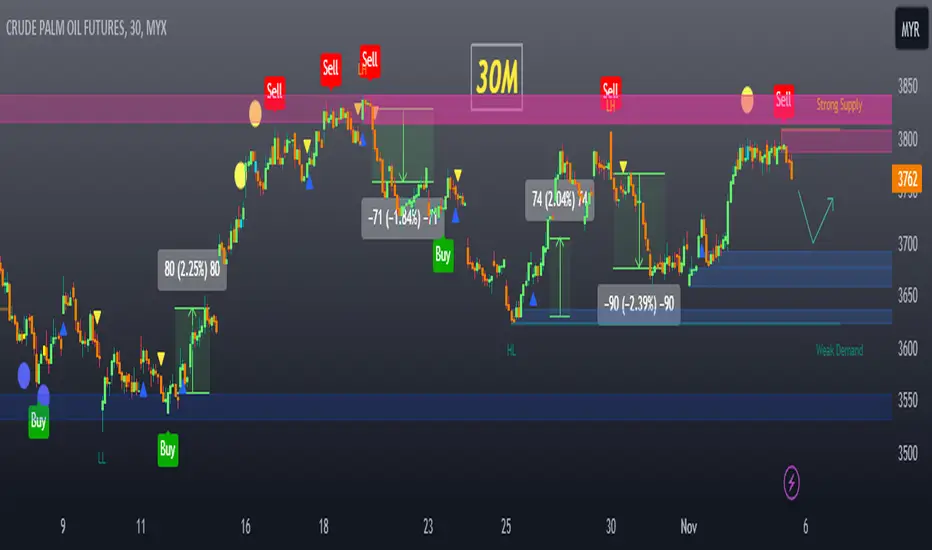
Another instrument included is supply and demand (SnD, OrderBlock) to complete the technical to facilitate users in trading activities.
=========================================
This indicator strategy is not suitable for the forex, stock, and crude oil markets. It’s only tested on FCPO and CRYPTO(BTC, ETH, BNB) markets.
In fact, this indicator was built specifically for the Futures Crude Palm Oil ( FCPO ).
And it’s available for ANY TIMEFRAME. The selection of the time frame depends on the strategy. For example, the intraday strategy's appropriate time frame is 3M, 5M, and 15 minutes. For swing/overnight, 15M, 30M, 1H. The best-winning rates = 5M.
===========================================
The TCD INDICATOR ( wave trend ) follows swings in a volatile market which is why this particular indicator is very useful to identify the price at the bottom or the top and also be able to detect trend changes and divergences that occur.
Parameter that’s used
1. Stochastic Relative Strength Index
2. Moving Average ( Super Smooth)
3. Pivot point High-Low
4. Volume Threshold
==============================================
Key of indicator
a) Buy/Sell signals
= Regular divergence allows you to see a trend reversal or continuation. This is the
best signal to make decisions to sell short or buy long.
b) Blue/Yellow circles
= level of oversold/overbought. When it comes out, so trend potentially to reversal/changed.
Here we consider to buy/sell
c) Green/Red triangles
= They happen after oversold/overbought level. Here trend changes from the current trend.
It’s also for buy/sell signals for scalping.
d) Strong signals
= Strong buy/sell signals when both Red/Yellow circles and red Sell/green Buy
signals come out together. There is the best confirmation for the reversal of the
trend. Sometimes triangle signal also occurs. That was a Triple's signal.
e) Supply and Demand zone
= Blue line/background is supply zone and possibility for buy/target(TP) zone.
= Red line/background is demand zone and possibility for sell/target(TP) zone.
===============================================================
Display on the chart
Strong buy/sell
Day trading set-up
Swing set-up
DISCLAIMER:
All technical signals and strategies using this indicator are for educational purposes. Take it at your own risk.
Remove plots that are stacked on the main chart
Skrip jemputan sahaja
Hanya pengguna disahkan oleh penulis boleh mengakses skrip ini. Anda perlu memohon dan mendapatkan kebenaran untuk menggunakannya. Keizinan selalunya diberikan selepas pembayaran. Untuk lebih butiran, ikuti arahan penulis di bawah atau hubungi TraderAsist secara terus.
Ambil maklum bahawa skrip peribadi dan jemputan sahaja ini masih belum disemak oleh moderator skrip dan pematuhannya dengan Peraturan Dalaman adalah belum ditentukan. TradingView TIDAK menyarankan pembayaran atau penggunaan skrip kecuali anda mempercayai sepenuhnya penulis dan memahami bagaimana ia berfungsi. Anda juga boleh menjumpai alternatif sumber terbuka dan percuma yang lain di dalam skrip komuniti kami.
Arahan penulis
Penafian
Skrip jemputan sahaja
Hanya pengguna disahkan oleh penulis boleh mengakses skrip ini. Anda perlu memohon dan mendapatkan kebenaran untuk menggunakannya. Keizinan selalunya diberikan selepas pembayaran. Untuk lebih butiran, ikuti arahan penulis di bawah atau hubungi TraderAsist secara terus.
Ambil maklum bahawa skrip peribadi dan jemputan sahaja ini masih belum disemak oleh moderator skrip dan pematuhannya dengan Peraturan Dalaman adalah belum ditentukan. TradingView TIDAK menyarankan pembayaran atau penggunaan skrip kecuali anda mempercayai sepenuhnya penulis dan memahami bagaimana ia berfungsi. Anda juga boleh menjumpai alternatif sumber terbuka dan percuma yang lain di dalam skrip komuniti kami.