OPEN-SOURCE SCRIPT
Telah dikemas kini PCA Regime-Adjusted Momentum
Summary
The PCA Regime-Adjusted Momentum (PCA-RAM) is an advanced market analysis tool designed to provide nuanced insights into market momentum and structural stability. It moves beyond traditional indicators by using Principal Component Analysis (PCA) to deconstruct market data into its most essential patterns.
The indicator provides two key pieces of information:
A smoothed momentum signal based on the market's dominant underlying trend.
A dynamic regime filter that gauges the stability and clarity of the market's structure, advising you when to trust or fade the momentum signals.
This allows traders to not only identify potential shifts in momentum but also to understand the context and confidence behind those signals.
Core Concepts & Methodology
The strength of this indicator lies in its sound, data-driven methodology.
1. Principal Component Analysis (PCA)
At its core, the indicator analyzes a rolling window (default 50 periods) of standardized market data (Open, High, Low, Close, and Volume). PCA is a powerful statistical technique that distills this complex, 5-dimensional data into its fundamental, uncorrelated components of variance. We focus on the First Principal Component (PC1), which represents the single most dominant pattern or "theme" driving the market's behavior in the lookback window.
2. The Momentum Signal
Instead of just looking at price, we project the current market data onto this dominant underlying pattern (PC1). This gives us a raw "projection score" that measures how strongly the current bar aligns with the historically dominant market structure. This raw score is then smoothed using two an exponential moving averages (a fast and a slow line) to create a clear, actionable momentum signal, similar in concept to a MACD.
3. The Dynamic Regime Filter
This is arguably the indicator's most powerful feature. It answers the question: "How clear is the current market picture?"
It calculates the Market Concentration Ratio, which is the percentage of total market variance explained by PC1 alone.
A high ratio indicates that the market is moving in a simple, one-dimensional way (e.g., a clear, strong trend).
A low ratio indicates the market is complex, multi-dimensional, and choppy, with no single dominant theme.
Crucially, this filter is dynamic. It compares the current concentration ratio to its own recent average, allowing it to adapt to any asset or timeframe. It automatically learns what "normal" and "choppy" look like for the specific chart you are viewing.
How to Interpret the Indicator
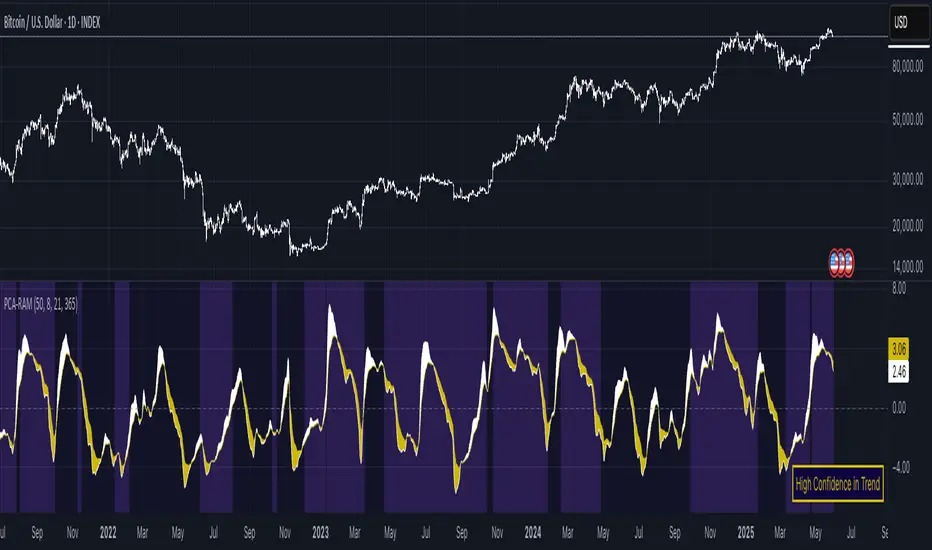
The indicator is displayed in a separate pane with two key visual elements:
The Momentum Lines (White & Gold)
White Line: The "Fast Line," representing the current momentum.
Gold Line: The "Slow Line," acting as the trend confirmation.
Bullish Signal: A crossover of the White Line above the Gold Line suggests a shift to positive momentum.
Bearish Signal: A crossover of the White Line below the Gold Line suggests a shift to negative momentum.
The Regime Filter (Purple & Dark Red Background)
This is your confidence gauge.
Navy Blue Background (High Concentration): The market structure is stable, simple, and trending. Momentum signals are more reliable and should be given higher priority.
Dark Red Background (Low Concentration): The market structure is complex, choppy, or directionless. Momentum signals are unreliable and prone to failure or "whipsaws." This is a signal to be cautious, tighten stops, or potentially stay out of the market.
Potential Trading Strategies
This tool is versatile and can be used in several ways:
1. Primary Signal Strategy
Condition: Wait for the background to turn Purple, confirming a stable, high-confidence regime.
Entry: Take the next crossover signal from the momentum lines (White over Gold for long, White under Gold for short).
Exit/Filter: Consider exiting positions or ignoring new signals when the background turns Navy.
2. As a Confirmation or Filter for Your Existing Strategy
Do you have a trend-following system? Only enable its long and short signals when the PCA-RAM background is Purple.
Do you have a range-trading or mean-reversion system? It might be most effective when the PCA-RAM background is Navy, indicating a lack of a clear trend.
3. Advanced Divergence Analysis
Look for classic divergences between price and the momentum lines. For example, if the price is making a new high, but the Gold Line is making a lower high, it may indicate underlying weakness in the trend, even on a Purple background. This divergence signal is more powerful because it shows that the new price high is not being confirmed by the market's dominant underlying pattern.
The PCA Regime-Adjusted Momentum (PCA-RAM) is an advanced market analysis tool designed to provide nuanced insights into market momentum and structural stability. It moves beyond traditional indicators by using Principal Component Analysis (PCA) to deconstruct market data into its most essential patterns.
The indicator provides two key pieces of information:
A smoothed momentum signal based on the market's dominant underlying trend.
A dynamic regime filter that gauges the stability and clarity of the market's structure, advising you when to trust or fade the momentum signals.
This allows traders to not only identify potential shifts in momentum but also to understand the context and confidence behind those signals.
Core Concepts & Methodology
The strength of this indicator lies in its sound, data-driven methodology.
1. Principal Component Analysis (PCA)
At its core, the indicator analyzes a rolling window (default 50 periods) of standardized market data (Open, High, Low, Close, and Volume). PCA is a powerful statistical technique that distills this complex, 5-dimensional data into its fundamental, uncorrelated components of variance. We focus on the First Principal Component (PC1), which represents the single most dominant pattern or "theme" driving the market's behavior in the lookback window.
2. The Momentum Signal
Instead of just looking at price, we project the current market data onto this dominant underlying pattern (PC1). This gives us a raw "projection score" that measures how strongly the current bar aligns with the historically dominant market structure. This raw score is then smoothed using two an exponential moving averages (a fast and a slow line) to create a clear, actionable momentum signal, similar in concept to a MACD.
3. The Dynamic Regime Filter
This is arguably the indicator's most powerful feature. It answers the question: "How clear is the current market picture?"
It calculates the Market Concentration Ratio, which is the percentage of total market variance explained by PC1 alone.
A high ratio indicates that the market is moving in a simple, one-dimensional way (e.g., a clear, strong trend).
A low ratio indicates the market is complex, multi-dimensional, and choppy, with no single dominant theme.
Crucially, this filter is dynamic. It compares the current concentration ratio to its own recent average, allowing it to adapt to any asset or timeframe. It automatically learns what "normal" and "choppy" look like for the specific chart you are viewing.
How to Interpret the Indicator
The indicator is displayed in a separate pane with two key visual elements:
The Momentum Lines (White & Gold)
White Line: The "Fast Line," representing the current momentum.
Gold Line: The "Slow Line," acting as the trend confirmation.
Bullish Signal: A crossover of the White Line above the Gold Line suggests a shift to positive momentum.
Bearish Signal: A crossover of the White Line below the Gold Line suggests a shift to negative momentum.
The Regime Filter (Purple & Dark Red Background)
This is your confidence gauge.
Navy Blue Background (High Concentration): The market structure is stable, simple, and trending. Momentum signals are more reliable and should be given higher priority.
Dark Red Background (Low Concentration): The market structure is complex, choppy, or directionless. Momentum signals are unreliable and prone to failure or "whipsaws." This is a signal to be cautious, tighten stops, or potentially stay out of the market.
Potential Trading Strategies
This tool is versatile and can be used in several ways:
1. Primary Signal Strategy
Condition: Wait for the background to turn Purple, confirming a stable, high-confidence regime.
Entry: Take the next crossover signal from the momentum lines (White over Gold for long, White under Gold for short).
Exit/Filter: Consider exiting positions or ignoring new signals when the background turns Navy.
2. As a Confirmation or Filter for Your Existing Strategy
Do you have a trend-following system? Only enable its long and short signals when the PCA-RAM background is Purple.
Do you have a range-trading or mean-reversion system? It might be most effective when the PCA-RAM background is Navy, indicating a lack of a clear trend.
3. Advanced Divergence Analysis
Look for classic divergences between price and the momentum lines. For example, if the price is making a new high, but the Gold Line is making a lower high, it may indicate underlying weakness in the trend, even on a Purple background. This divergence signal is more powerful because it shows that the new price high is not being confirmed by the market's dominant underlying pattern.
Nota Keluaran
SummaryThe PCA Regime-Adjusted Momentum (PCA-RAM) is an advanced market analysis tool designed to provide nuanced insights into market momentum and structural stability. It moves beyond traditional indicators by using Principal Component Analysis (PCA) to deconstruct market data into its most essential patterns.
The indicator provides two key pieces of information:
A smoothed momentum signal based on the market's dominant underlying trend.
A dynamic regime filter that gauges the stability and clarity of the market's structure, advising you when to trust or fade the momentum signals.
This allows traders to not only identify potential shifts in momentum but also to understand the context and confidence behind those signals.
Core Concepts & Methodology
The strength of this indicator lies in its sound, data-driven methodology.
1. Principal Component Analysis (PCA)
At its core, the indicator analyzes a rolling window (default 50 periods) of standardized market data (Open, High, Low, Close, and Volume). PCA is a powerful statistical technique that distills this complex, 5-dimensional data into its fundamental, uncorrelated components of variance. We focus on the First Principal Component (PC1), which represents the single most dominant pattern or "theme" driving the market's behavior in the lookback window.
2. The Momentum Signal
Instead of just looking at price, we project the current market data onto this dominant underlying pattern (PC1). This gives us a raw "projection score" that measures how strongly the current bar aligns with the historically dominant market structure. This raw score is then smoothed using two an exponential moving averages (a fast and a slow line) to create a clear, actionable momentum signal, similar in concept to a MACD.
3. The Dynamic Regime Filter
This is arguably the indicator's most powerful feature. It answers the question: "How clear is the current market picture?". This is effectively a trending/mean-reverting market regime detector, but one that only works for this specific indicator. This means, it works as a confidence score for the indicator. The reason why it works only for this indicator and it's not necessarily universal is that the PCA may have detected an underlying pattern that gives it confidence in what the market movement is, but this doesn't mean that the market is on a global trending or mean reverting regime.
This feature calculates the Market Concentration Ratio, which is the percentage of total market variance explained by PC1 alone.
A high ratio indicates that the market is moving in a simple, one-dimensional way (e.g., a clear, strong trend).
A low ratio indicates the market is complex, multi-dimensional, and choppy, with no single dominant theme.
Crucially, this filter is dynamic. It compares the current concentration ratio to its own recent average, allowing it to adapt to any asset or timeframe. It automatically learns what "normal" and "choppy" look like for the specific chart you are viewing.
How to Interpret the Indicator
The indicator is displayed in a separate pane with two key visual elements:
The Momentum Lines (White & Gold)
White Line: The "Fast Line," representing the current momentum.
Gold Line: The "Slow Line," acting as the trend confirmation.
Bullish Signal: A crossover of the White Line above the Gold Line suggests a shift to positive momentum.
Bearish Signal: A crossover of the White Line below the Gold Line suggests a shift to negative momentum.
The Regime Filter (Purple & Dark Red Background)
This is your confidence gauge.
Navy Blue Background (High Concentration): The market structure is stable, simple, and trending. Momentum signals are more reliable and should be given higher priority.
Dark Red Background (Low Concentration): The market structure is complex, choppy, or directionless. Momentum signals are unreliable and prone to failure or "whipsaws." This is a signal to be cautious, tighten stops, or potentially stay out of the market.
Potential Trading Strategies
This tool is versatile and can be used in several ways:
Skrip sumber terbuka
Dalam semangat TradingView sebenar, pencipta skrip ini telah menjadikannya sumber terbuka, jadi pedagang boleh menilai dan mengesahkan kefungsiannya. Terima kasih kepada penulis! Walaupuan anda boleh menggunakan secara percuma, ingat bahawa penerbitan semula kod ini tertakluk kepada Peraturan Dalaman.
Penafian
Maklumat dan penerbitan adalah tidak bertujuan, dan tidak membentuk, nasihat atau cadangan kewangan, pelaburan, dagangan atau jenis lain yang diberikan atau disahkan oleh TradingView. Baca lebih dalam Terma Penggunaan.