PROTECTED SOURCE SCRIPT
Demand/Supply Oscillator_immy
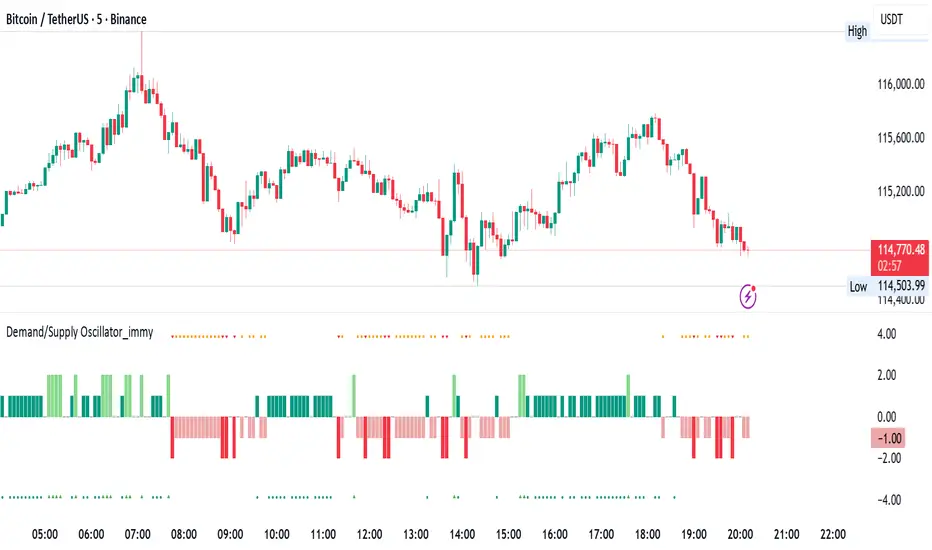
Demand/Supply Oscillator, probably the only D/S oscillator on TV which doesn't draw the lines on the chart but to show you the actual reasons behind the price moves.
Concept Overview
A demand/supply oscillator would aim to look for the hidden spots/order which institutes place in small quantities to not to upset the trend and suddenly place one big order to liquidate the retailers and make a final big move.
The lite color candles in histogram shows the hidden demand/supply which is the reason behind the sudden price pullback, even for short period of time.
Measure demand and supply based on volume, price movement, or candle structure
Identify price waves or impulses (e.g., using fractals, zigzag, or swing high/low logic)
Detect hidden demand/supply (e.g., low volume pullbacks or absorption zones)
Plotted on histogram boxes to visualize strength and direction of each wave
What “Hidden Demand” Means?
Hidden demand refers to buying pressure that isn’t immediately obvious from price action — in other words, buyers are active “behind the scenes” even though the price doesn’t yet show strong upward movement.
What Hidden supply Means?
refers to selling pressure that isn’t obvious yet on the price chart. It means smart money (big players) are quietly selling or distributing positions, even though the price might not be dropping sharply yet.
It usually appears when:
The price is pulling back slightly (down candle),
But volume or an oscillator (like RSI, MACD, or OBV) shows bullish strength (e.g., higher low or positive divergence).
That suggests smart money is accumulating (buying quietly) while the public may think it’s just a normal dip.
💹 Price Reaction — Up or Down?
If there is hidden demand, it’s generally a bullish signal → meaning price is likely to go up afterward.
However, on that exact candle, the price may still be down or neutral, because:
Hidden demand is “hidden” — buyers are absorbing supply quietly.
The move up usually comes after the hidden demand signal, not necessarily on the same candle.
📊 Example
Suppose:
Price makes a slightly lower low,
But RSI makes a higher low → this is bullish (hidden) divergence, or “hidden demand.”
➡️ Interpretation:
Smart buyers are stepping in → next few candles likely move up.
The current candle might still be red or show a small body — that’s okay. The key is the shift in underlying strength.
🧭 Quick Summary
Term Meaning Candle Effect Expected Move After
Hidden Demand Buyers active below surface Candle may still go down or stay flat
Hidden Supply Sellers active behind the scenes Price likely to rise soon
🛠️ Key Components
Best results with Price/Action e.g. Use swing high/low or zigzag to segment price into waves.
Optionally apply fractal logic for more refined wave detection
Combine with other indicators (e.g., RSI, OBV) for confirmation
Include zone strength metrics (e.g., “Power Number” as seen in some indicators)
Demand/Supply Calculation
Demand: Strong bullish candles, increasing volume, breakout zones
Supply: Strong bearish candles, volume spikes on down moves
Hidden Demand/Supply: Pullbacks with low volume or absorption candles
Histogram Visualization
Use plot() or plotshape() to draw histogram bars
Color-code bars: e.g., green for demand, red for supply, lite colors for hidden zones
Add alerts for wave transitions or hidden zone detection
How It Works
Demand/Supply: Detected when price moves strongly with volume spikes.
Hidden Zones: Detected when price moves but volume is low (potential absorption).
Histogram Values:
+2: Strong Demand
+1: Hidden Demand
-1: Hidden Supply
-2: Strong Supply
0: Neutral
Feature Demand (Visible) Hidden Demand
Visibility Clearly seen on price charts Subtle, often masked in consolidation
Participants Retail + Institutional Primarily Institutional
Price Behavior Sharp rallies from zone Sideways movement, low volatility
Tools to Identify Candlestick patterns, support zones Volume profile, order flow, price clusters
Risk/Reward Moderate (widely known) High (less crowded, early entry potential)
Skrip dilindungi
Skrip ini diterbitkan sebagai sumber tertutup. Akan tetapi, anda boleh menggunakannya secara bebas dan tanpa apa-apa had – ketahui lebih di sini.
Penafian
Maklumat dan penerbitan adalah tidak bertujuan, dan tidak membentuk, nasihat atau cadangan kewangan, pelaburan, dagangan atau jenis lain yang diberikan atau disahkan oleh TradingView. Baca lebih dalam Terma Penggunaan.