OPEN-SOURCE SCRIPT
Telah dikemas kini [blackcat] L3 Gradient Swings of Bull and Bear
Level 3
Background
Some friends in the TradingView community say that my technical indicators are too complicated to write. Is there anything that is easy to use? This time I will publish a simple indicator to use.
Function
This indicator uses a custom stochastic indicator as its initial value. Calculate the difference between the short-term and long-term EMA moving averages twice. Find the geometric mean of the above values and calculate the variance value. According to this algorithm, two sets of variance values are calculated respectively, one is the fast line and the other is the slow line. Finally, the 22-period EMA of the fast and slow lines is used as the final output value. This output can effectively reflect the band characteristics of the price.

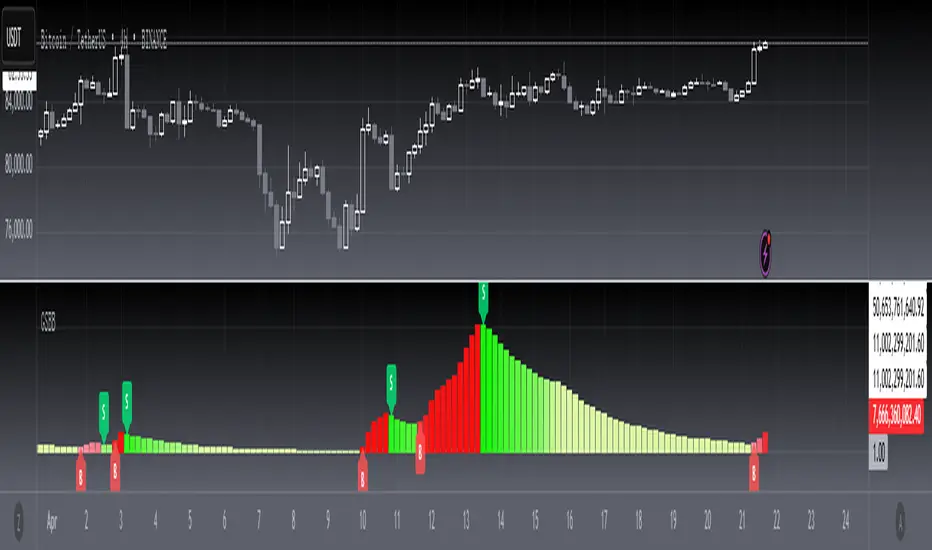
Because this output is relatively smooth, it can effectively filter out clutter noise, so you can clearly see the shape of the entire band. Go long during an uptrend and go short on the contrary. I use red and green gradients for longs and shorts respectively. The entry points are identified by red and green labels at the start of the band. In addition, the filtered peaks and troughs are also the basis for technical divergence judgments, so I added divergence identification lines.

The disadvantage of this indicator is that it is prone to many interference signals in the sideway stage. In order to filter out these signals and extract only useful trend signals, the user can enter a threshold in the settings dialog and select an appropriate display threshold in combination with the amplification factor. This way the part between 0 and the threshold will be grayed out. The gray area is the sideway, where the signal can be ignored.

Remarks
Feedbacks are appreciated.
Background
Some friends in the TradingView community say that my technical indicators are too complicated to write. Is there anything that is easy to use? This time I will publish a simple indicator to use.
Function
This indicator uses a custom stochastic indicator as its initial value. Calculate the difference between the short-term and long-term EMA moving averages twice. Find the geometric mean of the above values and calculate the variance value. According to this algorithm, two sets of variance values are calculated respectively, one is the fast line and the other is the slow line. Finally, the 22-period EMA of the fast and slow lines is used as the final output value. This output can effectively reflect the band characteristics of the price.
Because this output is relatively smooth, it can effectively filter out clutter noise, so you can clearly see the shape of the entire band. Go long during an uptrend and go short on the contrary. I use red and green gradients for longs and shorts respectively. The entry points are identified by red and green labels at the start of the band. In addition, the filtered peaks and troughs are also the basis for technical divergence judgments, so I added divergence identification lines.
The disadvantage of this indicator is that it is prone to many interference signals in the sideway stage. In order to filter out these signals and extract only useful trend signals, the user can enter a threshold in the settings dialog and select an appropriate display threshold in combination with the amplification factor. This way the part between 0 and the threshold will be grayed out. The gray area is the sideway, where the signal can be ignored.
Remarks
Feedbacks are appreciated.
Nota Keluaran
OVERVIEWThe [blackcat] L3 Gradient Swings of Bull and Bear is an advanced TradingView indicator that identifies potential trend reversals using custom gradient calculations based on price action.
FEATURES
Customizable sideway threshold and scale coefficient inputs
Advanced algorithm to calculate gradient swings
Dynamic coloring based on recent values
Labels for buy/sell signals
Divergence detection with configurable parameters
INSTALLATION AND INPUT PARAMETERS
To use this script:
Add it as a new study in your TradingView chart.
Adjust the following input parameters:
Sideway Threshold (default: 1.0)
Scale Coefficient (default: 1.0)
Color Lookback Period (default: 21)
Pivot Lookback Left/Right (default: 5 each)
Max/MIn Range for Divergences (defaults: 60/5)
Enable/disable different types of divergences
HOW TO USE
The main line represents the calculated gradient swing value.
Green columns indicate positive momentum, while red indicates negative momentum.
'B' labels mark potential buying opportunities.
'S' labels mark potential selling opportunities.
Divergence markers appear when price and oscillator diverge under specified conditions.
DIVERGENCE TYPES
This script detects four types of divergences:
Regular Bullish
Hidden Bullish
Regular Bearish
Hidden Bearish
Each type has its own plotting options which can be enabled or disabled via input settings.
NOTES
This script uses complex mathematical calculations and may require significant processing power depending on the timeframe and number of bars displayed.
Always combine indicators with other forms of analysis before making trading decisions.
Backtest thoroughly before relying on any strategy derived from this indicator.
Skrip sumber terbuka
Dalam semangat TradingView sebenar, pencipta skrip ini telah menjadikannya sumber terbuka, jadi pedagang boleh menilai dan mengesahkan kefungsiannya. Terima kasih kepada penulis! Walaupuan anda boleh menggunakan secara percuma, ingat bahawa penerbitan semula kod ini tertakluk kepada Peraturan Dalaman.
Avoid losing contact!Don't miss out! The first and most important thing to do is to join my Discord chat now! Click here to start your adventure: discord.com/invite/ZTGpQJq 防止失联,请立即行动,加入本猫聊天群: discord.com/invite/ZTGpQJq
Penafian
Maklumat dan penerbitan adalah tidak bertujuan, dan tidak membentuk, nasihat atau cadangan kewangan, pelaburan, dagangan atau jenis lain yang diberikan atau disahkan oleh TradingView. Baca lebih dalam Terma Penggunaan.